My colleague Rosa Orlandini’s Residential School Locations Project was used in a workshop today as an example of best practices in making data openly available. It is one result of her sabbatical work last year, which I couldn’t hope to summarize properly, but the metadata explains more about it, the Wikipedia article Canadian Indian residential school system gives background, and you can email her for more.
When I looked at the data and saw Indian Residential School Locations Dataset (CSV Format) I loaded it up into R and made a quick map. (If you try to get the data by hand it makes you agree to terms and conditions even though it’s CC-BY, which I’ll report, but I found that if you link directly to the CSV there’s no problem.)
library(tidyverse)
library(maps)
ca_map <- map_data(map = "world") %>% filter(region == "Canada")

read_csv("https://dataverse.scholarsportal.info/api/access/datafile/75625?format=original&gbrecs=true") %>%
   ggplot() +
   geom_polygon(data = ca_map,
     aes(x = long, y = lat, group = group),
	 fill = NA, colour = "black") +
   coord_map(projection = "gilbert") +
   geom_point(data = irs_locations, aes(x = Longitude, y = Latitude)) +
   labs(title = "Indian Residential Schools Location Dataset",
        subtitle = "Data provided by Rosa Orlandini (https://doi.org/10.5683/SP2/RIYEMU) (CC-BY)",
        caption = "William Denton (CC-BY)",
        x = "", y = "")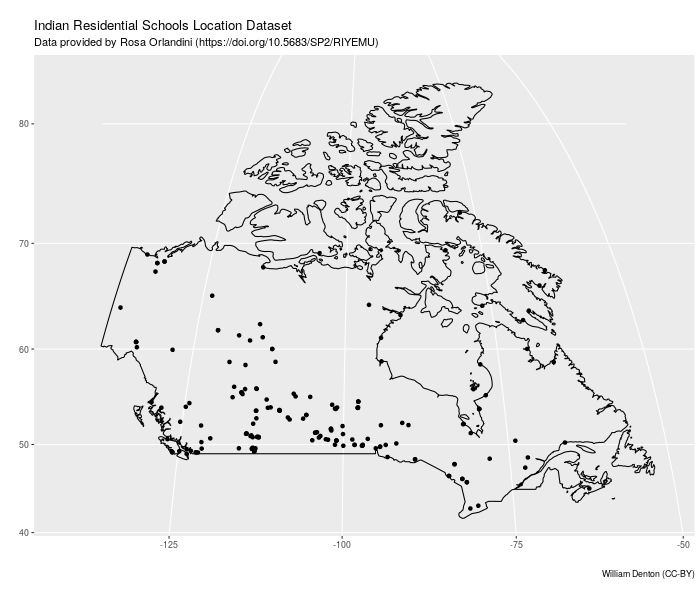
It’s hard to see some of the dots, and there are factors in the data that would be useful to show, like religious affiliations of the schools, but as a first look it’s a decent start.