I had an idea for one more thing to look at in the #c4l13 tweets: instead of seeing who retweeted whom, how about who mentioned whom?
To do this I use a little Ruby script to make my life simpler. I could have done this all in R, but it was starting to get messy (I'm no R expert) and I could see right away how to do it in Ruby, so I did it that way.
In that big CSV file we downloaded of all the tweets, there's one column called entities_str that is a chunk of JSON that holds what we want. Twitter has parsed each tweet and figured out some things about it, including who is mentioned in the tweet. This means we don't have to do any pattern matching, but we do need to parse some JSON. That's why I used Ruby.
#!/usr/bin/env ruby

require 'csv'

require 'rubygems'
require 'json'

archive = "Downloads/Collect %23c4l13 Tweets - Archive.csv"

# Thanks http://stackoverflow.com/questions/3717464/ruby-parse-csv-file-with-header-fields=as-attributes-for-each-row

puts "tweeter,mentioned"
CSV.foreach(archive, {:headers => true, :header_converters => :symbol}) do |row|

  # (Those header directives make it easier to reference elements in each row.)
  # row[:from_user] is the person who tweeted.
  # To find out who they mention, we can use information supplied by Twitter.
  # row[:entities_str] is a chunk of JSON.  It has an object called "user_mentions" which is an array of objects
  # like this:
  # {"id"=>18366992, "name"=>"Jason Ronallo", "indices"=>[83, 91], "screen_name"=>"ronallo", "id_str"=>"18366992"}
  # So all we need to do is loop through that and pick out out screen_name

  JSON.parse(row[:entities_str])["user_mentions"].each do |mention|
    puts "#{row[:from_user]},#{mention["screen_name"]}"
  end

end
I saved this as mentioned.rb and then ran this at the command line:
$ ruby mentioned.rb > tweets-mentioned.csv
$ head -5 tweets-mentioned.csv
tweeter,mentioned
anarchivist,mariatsciarrino
anarchivist,eosadler
tararobertson,ronallo
saverkamp,benwbrum
Perfect. Now let's get this into R and use geom_tile again. We'll read it into a data frame and then use count to see who's mentioned who how much:
> library(ggplot2)
> library(plyr)
> mentioned.csv <- read.csv("tweets-mentioned.csv")
> head(count(mentioned.csv, c("tweeter", "mentioned")))
         tweeter     mentioned freq
1     3windmills         yo_bj    1
2    aaroncollie        kayiwa    1
3 aaronisbrewing tararobertson    1
4     abedejesus tararobertson    1
5       abugseye  bretdavidson    1
6       abugseye     cazzerson    1
That's just the first few mentions, but we've got what we want. Now let's make a big huge chart.
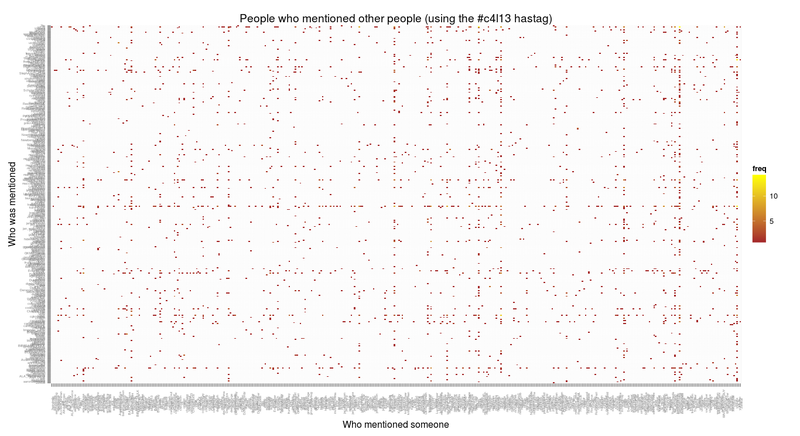
> ggplot(count(mentioned.csv, c("tweeter", "mentioned")), aes(x=tweeter, y=mentioned))
+ geom_tile(aes(fill=freq))
+ scale_fill_gradient(low="brown", high="yellow")
+ theme(axis.text = element_text(size=4), axis.text.x = element_text(angle=90))
+ xlab("Who mentioned someone") + ylab("Who was mentioned")
+ labs(title="People who mentioned other people (using the #c4l13 hastag)")
That's got an awful lot going on, but we can can see some strong horizontal lines (showing people who were mentioned a lot, especially chief conference organize Francis Kayiwa @kayiwa) and some strong vertical lines (showing people who mentioned many other people). To simplify it a lot, let's subset the frequency table to include only people who mentioned other people at least twice.
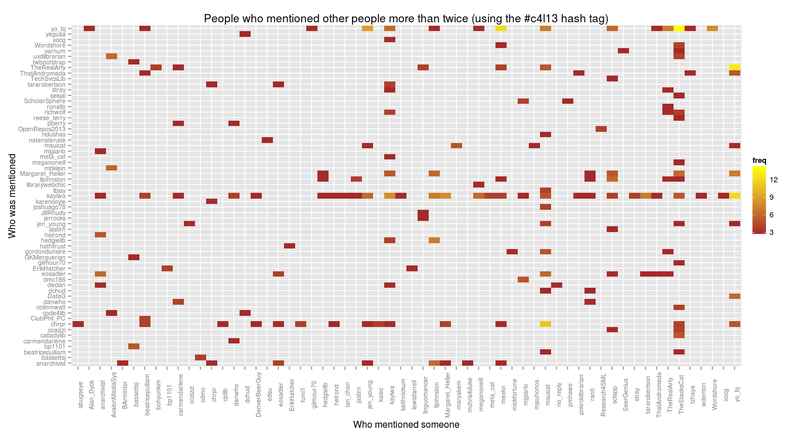
> ggplot(subset(count(mentioned.csv, c("tweeter", "mentioned")), freq > 2), aes(x=tweeter, y=mentioned))
+ geom_tile(aes(fill=freq)) + scale_fill_gradient(low="brown", high="yellow")
+ theme(axis.text = element_text(size=8), axis.text.x = element_text(angle=90))
+ xlab("Who mentioned someone") + ylab("Who was mentioned")
+ labs(title="People who mentioned other people more than twice (using the #c4l13 hash tag")
Now it's easier to see that kayiwa was mentioned by a lot of people, and going vertically, among others TheStacksCat mentioned a lot of different people, especially yo_bj.
And now I think I've exhausted my interest in this. Time to look at something else!
 Miskatonic University Press
