Ref desk 2: Questions asked per week at a branch
So we have a nice long file that records the details of 87,464 reference desk interactions since February 2011.
$ wc -l libstats.csv
87464 libstats.csv
$ head -5 libstats.csv
question.type,question.format,time.spent,library.name,location.name,initials,timestamp
4. Strategy-Based,In-person,5-10 minutes,Scott,Drop-in Desk,CC,02/01/2011 09:20:11 AM
4. Strategy-Based,In-person,10-20 minutes,Scott,Drop-in Desk,CC,02/01/2011 09:43:09 AM
4. Strategy-Based,In-person,5-10 minutes,Scott,Drop-in Desk,CC,02/01/2011 10:00:56 AM
3. Skill-Based: Non-Technical,Phone,5-10 minutes,Scott,Drop-in Desk,CC,02/01/2011 10:05:05 AM
Let’s look at it in R. First load in three libraries we’re going to need: lattice for graphics, Hadley Wickham’s plyr for data manipulation, and chron to help us with dates. Then load the CSV file into a data frame called libstats.
> library(lattice)
> library(plyr)
> library(chron)

> libstats <- read.csv("libstats.csv")
Each line in the file represents a single reference desk interaction. I want to analyze them by the week, so I add a column that specifies which week the interaction happened. This seems to be a pretty ugly way of doing it, but it works. The week column gets filled with YYYY-MM-DD dates that are the Mondays of the week in question.
> libstats$week <- as.Date(cut(as.Date(libstats$timestamp, format="%m/%d/%Y %r"), "week", start.on.monday=TRUE))
> head(libstats,4)
                  question.type question.format    time.spent library.name
1             4. Strategy-Based       In-person  5-10 minutes        Scott
2             4. Strategy-Based       In-person 10-20 minutes        Scott
3             4. Strategy-Based       In-person  5-10 minutes        Scott
4 3. Skill-Based: Non-Technical           Phone  5-10 minutes        Scott
  location.name initials              timestamp       week
1  Drop-in Desk       CC 02/01/2011 09:20:11 AM 2011-01-31
2  Drop-in Desk       CC 02/01/2011 09:43:09 AM 2011-01-31
3  Drop-in Desk       CC 02/01/2011 10:00:56 AM 2011-01-31
4  Drop-in Desk       CC 02/01/2011 10:05:05 AM 2011-01-31
> up.to.week <- tail(levels(as.factor(libstats$week)), 1)
up.to.week is the most recent week date, and I’ll use it for labelling charts. levels tells you the elements in a list of factors. The names of the library branches are a great example: there are eight different values for library.name through out 87,464 entries, one for each of our libraries plus one for an information desk that doesn’t do research help. (The Osgoode Hall Law School Library doesn’t record their reference statistics in this system so they’re not here.)
> branches <- levels(libstats$library.name)
> branches
[1] "ASC"               "Bronfman"          "Frost"             "Maps"              "Scott"
[6] "Scott Information" "SMIL"              "Steacie"
Let’s look at the statistics for the Bronfman library. Turns out there are 10,754 encounters recorded there.
> bronfman <- subset(libstats, library.name == "Bronfman")
> nrow(bronfman)
[1] 10754
We have a problem to solve before we can make a chart. Each line in the bronfman data frame records one desk enounter. We want to analyze things by the week. How do we aggregate a week’s worth of data into one number? We’ll use ddply, whose help files defines what it does as: “For each subset of a data frame, apply function then combine results into a data frame.”
A short example will help explain it. Make a data frame about some coloured clothing. ddply(tmp, .(colour), nrow) means “look at the data frame called tmp, pick out the individual entries in the colour column, and run the function nrow on each element to find out how many of them there are.” Using nrow here is a nice way of counting up how many of something there are, but if you were doing real statistics you might use mean or some other function.
> tmp <- data.frame(colour = c("red", "red", "green", "red", "blue"),
                    item = c("shirt", "socks", "shirt", "socks", "socks"))
> tmp
  colour  item
1    red shirt
2    red socks
3  green shirt
4    red socks
5   blue socks
> ddply(tmp, .(colour), nrow)
  colour V1
1   blue  1
2  green  1
3    red  3
> ddply(tmp, .(item), nrow)
   item V1
1 shirt  2
2 socks  3
Back to our bronfman data frame. For each week I want to know how many of question.type was asked:
> questions <- ddply(bronfman, .(question.type, week), nrow)w
> head(questions)
    question.type       week V1
1 1. Non-Resource 2011-01-31 44
2 1. Non-Resource 2011-02-07 58
3 1. Non-Resource 2011-02-14 43
4 1. Non-Resource 2011-02-21 20
5 1. Non-Resource 2011-02-28 49
6 1. Non-Resource 2011-03-07 37
This new data frame has a count of how many 1s were asked each week, then how many 2s, and so on up to how many 5s were asked each week. xyplot does the trick for making a chart of this:
> xyplot(V1 ~ as.Date(week) | question.type,
         data = questions,
         type = "h",
         main = "Questions asked at Bronfman",
         sub = paste("Feb 2011 to", up.to.week),
         ylab = "Number of questions",
         xlab = "Week",
         par.strip.text=list(cex=0.7),
         )

Notice how nicely R figured out how to label the x and y axes. Because it knows that the week column consists of dates, it was able to divide up the x-axis into three-month chunks. Beautiful.
Ref Desk 1: LibStats
The last couple of weeks I’ve been using R to understand the reference desk statistics we collect with LibStats. I’m going to write it up in a few posts, with R code that any other LibStats library can use to look at their own numbers.
First, a few things about LibStats. This is what it looks like:

For each reference desk encounter, we enter this information:
- Location. One of: Reference Desk, Office, Circulation Desk.
- Patron Type. Not required and largely unused. One of: NA, Undergraduate, Graduate, Faculty/Staff, Community.
- Question Type. One of:
- Non-Resource. These could be answered with a sign: “Where’s the bathroom?” “What time do you close?”)
- Skill-Based: Tech Support. “The printer is jammed.” “How do I use the scanner?”
- Skill-Based: Non-Technical. These are academic in nature but have a definite answer. “Do you have The Hockey Stick and the Climate Wars: Dispatches from the Front Lines by Michael E. Mann?” “How can I find this article my prof put on reserve?”
- Strategy-Based. These require a reference interview and involve the librarian and user discussing what the user needs and how he or she can best find it. “I need three peer-reviewed articles about X for an assignment.” “I’m writing a paper and need to find out about Y and its influence on Z.” Information literacy instruction is involved.
- Specialized. These are questions requiring special expert knowledge or the use of a special database or tool. All librarians can answer any general questions about whatever subjects their library covers, but deeper questions are referred to a subject librarian, and those are marked as Specialized. Also, questions requiring census data, or some arcane science or business or economics database or the like, would be counted here.
- Time Spent. One of: NA, 0-1 minute, 1-5 minutes, 5-10 minutes, 10-20 minutes, 20-30 minutes, 30-60 minutes, 60+ minutes.
- Question Format. One of: In-person, Phone, E-mail, Chat, Moodle. (I’m not sure how those last two are different.)
- Initials. In my case, WD.
- Time stamp. Added automatically by the system, but it’s possible to backdate questions.
- Question. The question asked. Not required (though it should be).
- Answer. The question asked. Not required (though it should be too).
The “Question Type” factor was the subject of the most debate when LibStats got rolled out last year, for two reasons. First, we all need to agree on the meaning of each category so that things can be fairly compared across branches. There are sample questions for each category to help guide us, and I think we all have a generally similar understanding, but there’s certainly some variance, with different people assigning essentially the same question to different categories.
Second, 1-3 don’t require a librarian, but 4-5 do. Instituting this system was seen by some as possibly the first step in taking librarians off the desk and moving to some kind of blended or triage model where non-academic staff would be at the desk and then refer users to librarians as necessary for the more advanced questions. This system is in place at our biggest and busiest branch, as we’ll see, but has not happened at the other branches. My analysis will help show whether or not it’s a good idea.
LibStats has various reports built into it, such as “Questions by Question Type” or “Questions by Time of Day,” and you can export to Excel, but they’re not very good, and the export to Excel link doesn’t work (probably a local problem, but I couldn’t be bothered to report it), so I used the “Data Dump” option to download a complete dump of all the questions from all the branches. It’s a CSV file with these columns:
question_idpatron_typequestion_typetime_spentquestion_formatlibrary_namelocation_namelanguageadded_stampasked_atquestion_timequestion_half_hourquestion_datequestion_weekdayinitials
(You’ll also notice that Question and Answer are not included. You’d have to query the database directly to get them, but for what I’m after I didn’t need to get into that.)
You can see how most of those map to the fields in the entry form, though the time the question was asked and the time it was entered are separated. asked_at is a full timestamp, but not in a proper standard form. question_time and those others are all other forms of the time, broken down to the day or half-hour or what have you, which make it easier to generate tables in Excel, where I imagine it’s painful to deal with timestamps.
In R it’s not, so I don’t need that stuff. But I do need to turn the asked_at timestamp into a proper timestamp, and I want to ignore all data from before February 2011 because it’s incomplete or test, and in August 2011 we renamed the Question Types. To take care of all that I wrote a quick Ruby script:
#!/usr/bin/env ruby

require 'rubygems'
require 'faster_csv'

arr_of_arrs = FasterCSV.read("all_libraries.csv")

puts "question.type,question.format,time.spent,library.name,location.name,initials,timestamp"

arr_of_arrs[1..-1].each do |row|
  csvline = []
  question_type = row[2]
  time_spent = row[3]
  question_format = row[4]
  library_name = row[5]
  location_name = row[6]
  timestamp = row[9]
  initials = row[14].to_s.upcase

  # Before Feb 2011 it was pretty much all test data
  next if Date.parse(timestamp) < Date.parse("2011-02-01")

  # Clean up data from before the question_type factors were changed
  if (question_type == "2a. Skill-Based: Technical")
    question_type = "2. Skill-Based: Tech Support"
  end
  if (question_type == "2b. Skill-Based: Non-Technical")
    question_type = "3. Skill-Based: Non-Technical"
  end
  if (question_type == "3. Strategy-Based")
    question_type = "4. Strategy-Based"
  end
  if (question_type == "4. Specialized")
    question_type = "5. Specialized"
  end

  # Timestamp is formatted so one-digit days are possible, so prepend 0 if necessary
  if (timestamp.index("/") == 1)
    timestamp = "0" + timestamp
  end

  csvline = [question_type, question_format, time_spent, library_name, location_name, initials, timestamp]
  puts csvline.to_csv
end
Looking at that now I realize I should have used if/else if, or switch, but that’s hardly the worst code you’re going to see in these posts so the hell with it.
Whenever I download the full data dump I run clean-up-libstats.rb > libstats.csv and get a file that looks like this:
question.type,question.format,time.spent,library.name,location.name,initials,timestamp
4. Strategy-Based,In-person,5-10 minutes,Scott,Drop-in Desk,XQ,02/01/2011 09:20:11 AM
4. Strategy-Based,In-person,10-20 minutes,Scott,Drop-in Desk,XQ,02/01/2011 09:43:09 AM
That’s the file I analyze in R, and I’ll start on that in the next post.
On Dentographs
I’m absolutely delighted that my paper On Dentographs, A New Method of Visualizing Library Collections has appeared in issue 16 of The Code4Lib Journal.
Gabriel Farrell was my editor. He did a great job and I thank him. We worked in an interesting way, which I described in Managing the draft of a paper as if it were source code. We used Git, and the gitk utility shows who’s been committing to a project and how the branches mix and merge. Here’s what the paper looked like over the last month:
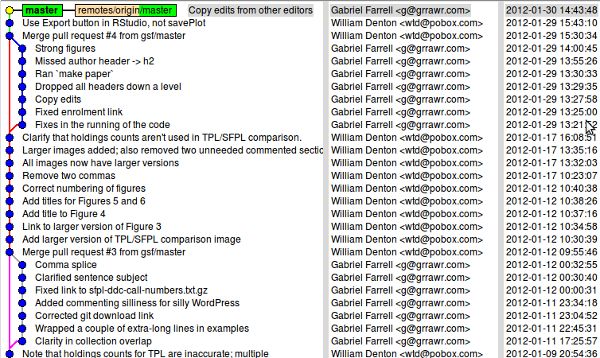
You can see how Gabriel did a bunch of work on it, then I made a bunch of changes in response to suggestions and questions he had, then he made more changes, and there was one last fix from each of us. It was a great way to collaborate, and the paper is much better for his work and that of the other editors.
Bill 'n' Bertie
William Butler Yeats, 1919: “The best lack all conviction, while the worst / Are full of passionate intensity” (“The Second Coming”).
Bertrand Russell, 1933: “The fundamental cause of the trouble is that in the modern world the stupid are cocksure while the intelligent are full of doubt.” (“The Triumph of Stupidity” in Mortals and Others: Bertrand Russell’s American Essays, 1931-1935, Routledge, 1998.)
Mamet and Costello
CAST:
- David Mamet
- Lou Costello (wearing a suit and short wide tie)
SCENE: A booth in a Chinese restaurant.
DAVID MAMET is sitting quietly, drinking a scotch.
LOU COSTELLO enters, sees MAMET, and reacts with his catchphrase: Heyyyyyyyyy, Mam-met!
MAMET: I’m here. I’m here. Don’t, the shouting. Don’t.
LOU sits down in the booth.
LOU: You’re running a baseball team now, right?
MAMET: I won the, in a poker game. I won the team in a poker game.
LOU: In a poker game? A baseball team?
MAMET: I had three kings. He had two aces. [Beat.] He lost the thing that matters most to him in the world. Now he has nothing. Now he goes back to work. That’s what a man does. He works.
LOU: Well, I never met the guys on the team, so you’ll have to tell me their names, and then I’ll know who’s playing on the team.
MAMET: The names? The names, I’ll tell you, I’ll tell you, but–funny names. Peculiar names.
LOU: Peculiar?
MAMET: Who’s on first, What’s on second, and I Don’t Know is on third.
LOU: You’re the owner?
MAMET: Yeah.
LOU: And you’re–
MAMET: And the manager.
LOU: The manager.
MAMET: And the …
LOU: The …
MAMET: The coach. I’m the coach. The coach too.
LOU: And you don’t know the fellows’ names?
MAMET (angrily): You’re saying I don’t know their names? I own the team and I don’t know their names? I manage the team and I don’t know their names? I coach the team and I don’t know their names? What am I? What am I?
LOU: Hey, hey, all I’m saying is–
MAMET: I know their names. I’m telling you their names. Are you listening? I’m talking. I’m telling your their names.
LOU: I’m saying, who’s on first?
MAMET: Yes.
LOU: The guy on first.
MAMET. Yes.
LOU: I mean the fellow’s name.
MAMET: Yes.
LOUL: The first baseman.
MAMET: Yes. Are you listening? Are you hearing me?
LOU: I’m hearing you.
MAMET: No, no, no, listen. Listen. We’re talking here–
LOU: We’re talking.
MAMET: We’re talking. We’re talking about the baseball team.
LOU: We’re speaking about the team.
MAMET: Speaking? Speaking? The hell? The hell? We’re speaking about the team now? Are we actually speaking about it? Or are we just talking?
LOU (hands up, placatingly): We’re just talking. We’re just talking.
MAMET: We’re just talking.
LOU: All right.
MAMET: All right. All right. Jesus. We’re talking.
LOU: But who’s on first?
MAMET: Are you hearing me? Are you hearing me. I don’t think you are. We’re sitting here and I’m talking but you are not [pause, then more calmly] hearing me. Jesus. Yes. Who is on first.
LOU: That’s what I’m asking you!
MAMET: I’m telling you.
LOU: Who.
MAMET: Yes.
LOU: Who is on first.
MAMET: Yes.
LOU: How often do you pay the players?
MAMET: Every week.
LOU: When you pay the first baseman, what name do you put on the cheque?
MAMET: Cheque? I don’t pay them with a cheque. I use direct deposit.
LOU: What’s the name on his bank account?
MAMET: Who.
LOU: The first baseman.
MAMET: Yes.
LOU: Yes?
MAMET: Yes. Yes.
LOU: Yes is the name on his bank account.
MAMET: What do you, what do you, what is this? I mean what is this? Why do you care how he gets paid? Murray got the account number off a blank cheque. What do I care about his account?
LOU: What was the name on his blank cheque?
MAMET: No, What’s on second.
LOU: I’m not asking you who’s on second!
MAMET: Who’s on first.
LOU: I don’t know.
MAMET: He’s on third.
LOU: Fuck you.
Last names
Anyone with any of these last names must, I believe, acquire a Ph.D. or M.D. in order to be addressed as “Doctor:”
- No
- Strange
- Love
- Strangelove
- Funkenstein
How I set up a virtual server at VPSVille
I need a shell server because I filter my email with Procmail and then read it with Alpine. I’ve been doing this since I got on the Internet in 1993 (though back then I used Pine) and I don’t feel any need to change. That’s the kind of fellow I am: the kind who uses a now-obscure text-only Unix email reader, and writes grumpily on his web site about it. I use Thunderbird for work email but for personal use the simplicity of Alpine is exactly what I want. I certainly don’t want Google handling my mail.
My old shell server provider wasn’t cutting it any more, so late last year I moved to VPSVille. It’s been about a month and so far everything’s fine. My shell server has been up 100% of the time and my support questions are answered promptly and helpfully. Once someone recognized my domain name and made a joke about Cthulhu, which has never happened before.
I’ve heard great things about Linode and Slicehost, but VPSVille is one thing they aren’t: Canadian. I want my email hosted here in Canada. I want all my data hosted in Canada. With VPSVille I can do that — in fact their servers are in downtown Toronto — but I also have the option to host something in the UK, which I’ve heard some people do to set up a proxy server so they can watch the BBC online.
Anyway, everything went fine getting set up at VPSVille. At first I went with some option where there’s a control panel to the site, but that turned out to be pretty useless for me, so I just ordered a minimal Debian 6 and then installed everything I need. A lot of sudo apt-get install foo later I had what I needed. (And remember that dpkg --get-selections lists all the packages you have installed, and you can use that list on a new server to install everything you had on the old one.)
I ran into two small problems with email. I’ve never hosted my own email before and I was nervous about it, but it turned out to be easy. I went with Exim, and I was glad I could stay away from configuring Sendmail. Setting up Exim was simple; Debian has a menu thing where you answer a few questions and it makes the config file, and the only thing that slowed me up for a few minutes was not leaving one field blank to make it so email was accepted from any host. The first real problem was Permission denied: creating lock file hitching post errors, but changing the perms on /var/mail fixed that. The second problem was that my .forward file, which directed all mail to procmail, was causing errors. Turns out I didn’t need it at all! Exim is smart enough on its own to see that I have a .procmailrc file and know what to do.
So now I’m using my shell server for reading email and for hosting some personal Git repositories. If all keeps going well I’ll move some of my web sites over too. Right now I use Pair Networks for hosting. They are an excellent company, extremely reliable and with great technical support, but they’re American, and I would like to host my sites in Canada. I’ll see. I don’t mind running my own server as long as I don’t have to manage the hardware.
George Pelecanos, The Cut
After returning home from the gym Denton showered, shaved and dressed. He put on a blue Viyella shirt from Stollery’s, tan flat-front Dockers, argyle socks, and ankle-high leather kicks from Aldo. He felt good. He poured himself a glass of an inexpensive Argentine Malbec that had gotten a good review in Toronto Life a couple of months before. He had picked it up at that LCBO on Yonge around Summerhill, the big one in the old train station. He had an hour to kill before heading out for the evening.
Denton sat on the cream-coloured sofa he had bought at an auction over ten years before. It was looking a little worse for wear, and his cats had scratched the back of it, but no-one could see so he didn’t mind. Sofa suited him fine, no need to go spending a lot of money just because of a few tears. It was comfortable. He liked that.
On the table was a copy of the new Pelecanos joint, The Cut, which he’d started reading the night before. Can’t read Pelecanos without some music, he thought, and he put on the new Trombone Shorty joint, For True, that he’d picked up when he saw Shorty perform at the Opera House in November. Man put on a show. Played the trombone and the trumpet and sang and danced and worked the crowd. At the end of the show everyone in the band switched instruments and Shorty even played the drums. Damn, people were exhausted and sweaty just watching. Be good to see Shorty perform in his home town, New Orleans, some time, maybe on Frenchman Street. The music came through his speakers at a strong but reasonable volume and Denton relaxed.
Denton picked up the book after putting his Android smartphone on silent so that he wouldn’t be disturbed. He’d admired Pelecanos’s work for a long time. Even exchanged a bit of email with him years ago. Seemed like a regular guy, the kind you could have a beer with. Or a glass of Argentine Malbec. Man knew how to write. He’d staked out Washington DC as his own territory, but not the DC with the politicians and the rich people. The DC with real people, middle-class and poor. People who worked. Pelecanos told stories about trying to be a man, an honest man working hard, in a world full of hate and crime. King Suckerman, the DC Quartet … those were some fine books. Seemed like he often told the same story, but he told it well, in a straight-forward style. And he always mentioned good music and movies and books. Denton liked that. When he knew the music and movies and books it made him feel good, like he was on the inside. When he didn’t know them, he looked them up. Pelecanos had worked on The Wire and Treme, two of Denton’s favourite television shows. Man was talented.
After an hour of reading the book, Denton was disappointed. Seemed like all the freshness was gone and all the man did now was list clothing labels and bands and streets and never really described people. The plots and characters were all tired repeats of previous novels. Pelecanos was getting into some new characters, and dealing with young veterans of the war in Afghanistan, but it didn’t work like the old stories.
Damn, Denton thought, this shit isn’t so tight any more.