Abstract
The data I requested in March 2018 through provincial freedom of information legislation was supplied last month, and the costs paid by York University Libraries for electronic resources in fiscal years 2017 and 2018 are now public: York University Libraries eresource costs (DOI: 10.5683/SP2/K1XCLU). There are three files: the data (extracted by me; available as CSV or in other formats; it is not complete, there are some redactions in what I was given), an R Markdown file with a basic R script to do some simple analysis, and the PDF released to me by York that is the responsive record.
Librarian Bill prepared the data that was released to Civilian Bill, who turned it into a more usable form and gave it back to Librarian Bill to post in York University’s official data repository. Both of us are pleased that this can be added to the list of York University librarian and archivist research outputs, and that it stands as an example of York University Libraries’ commitment to open data.

Background
I first wrote about this on 22 August 2018, in Freedom of information request for York University eresource costs denied.
I’m a librarian at York University Libraries in Toronto. Let’s call me Librarian Bill when I’m there. At home I’m Civilian Bill, and last month Civilian Bill put in a freedom of information request to York University for the amounts the Libraries spent on electronic resources in fiscal years 2017 and 2018. Civilian Bill knew the information exists because Librarian Bill prepared a spreadsheet with precisely those costs.
York has refused to release the data. Their response is “withhold in full.”
I made this request under Ontario’s Freedom of Information and Protection of Privacy Act (FIPPA) because I was inspired by Jane Schmidt’s talk Innovate this! Bullshit in Academic Libraries and What We Can Do About It. She said:
My challenge to all of you here today is to go back to your libraries and start shining a light into the deep recesses of the databases you use…. Do you know how much your library spends on the products you use every day? Are you able to speak confidently on how those prices have fluctuated over time and why they have? If something doesn’t work the way that we think it should or as it is advertised, why is an increase in price—no matter how modest—a given? These are all questions that we need to start asking more consistently. Also, thank you, Simon Fraser University and University of Alberta, for taking the lead on sharing your expenditure data.
In July Civilian Bill filed my request. It was denied. Civilian Bill appealed and eventually won. As reported on 14 March 2019 in Freedom of information appeal for York University eresource costs successful:
Seven months later Civilian Bill and Librarian Bill am very happy to report the data will be released.
York University said in their response:
As a result of mediation with [the mediator] at the Information and Privacy Commission York University would like to suggest a possible resolution to Appeal PA-18-403. York University is committing the resources necessary to schedule the release of this information with a goal of April 30, 2020 for the completion of this project. It is hoped that this will resolve the appeal.
I marked 30 April 2020 in my calendar.

The deadline approaches
Summer and fall of 2019 came and went … the days grew short … winter began … then the days began to lengthen. By February the change was really noticeable. My mood brightened. Spring would be here soon. Finally! And with spring would come the FIPPA response. I waited quietly. Would it happen? It? The final absurd irony?
On 04 March 2020 I received an official email from Patti Ryan, director of Content Development and Analysis (my department, called CDA), working through channels. The email said in part:
I am writing to request your help with doing a final check of the eResources cost data for F2017 and F2018 in order to prepare for their release to the privacy office. Recall that this has been requested from the DLO [Dean of Libraries’ Office] in connection with a freedom of information request, but is also part of CDA’s workplan.
Yes! It happened! Librarian Bill was being asked to prepare the data for release to Civilian Bill! We was overjoyed. If you ever meet one of the Bills in person, let him tell you about this, because I love talking about it.
I responded immediately to confirm that of course I would work on this. This is provincial legislation we’re talking about! And open data! I was pleased to see the work fitted with Goal 1 of the Libraries’ 2016–2020 strategic plan: “Advance the University Community’s Evolving Engagement with Open Scholarship.” It’s great when something you really believe in is part of your institution’s strategic plan.
By early April Librarian Bill finished up a new spreadsheet containing all the data. I was directed to compare the data to the University of Alberta Libraries cost release to double check anything redacted there but not in what I had prepared. The eresources librarian, Aaron Lupton, checked any final missing non-disclosure details with vendors. With all that done, I handed it back through channels and waited.

The deadline passes
The end of April arrived. May began. May continued. I waited. Nothing.
On 11 May Civilian Bill emailed York’s Information and Privacy Office to ask about the status of the release. That email never arrived, but Librarian Bill followed up on 19 May and got a quick response saying the release had been posted earlier in the month, but mail delivery is slow and we could have a PDF by email. I waited over the weekend to see if the envelope would arrive, but it didn’t. On 26 May the response was supplied as a PDF.
The envelope has still not arrived in the post.

The responsive record
This is the PDF I got: Cost_release_data_F2017_F2018.pdf. Here is the first page.
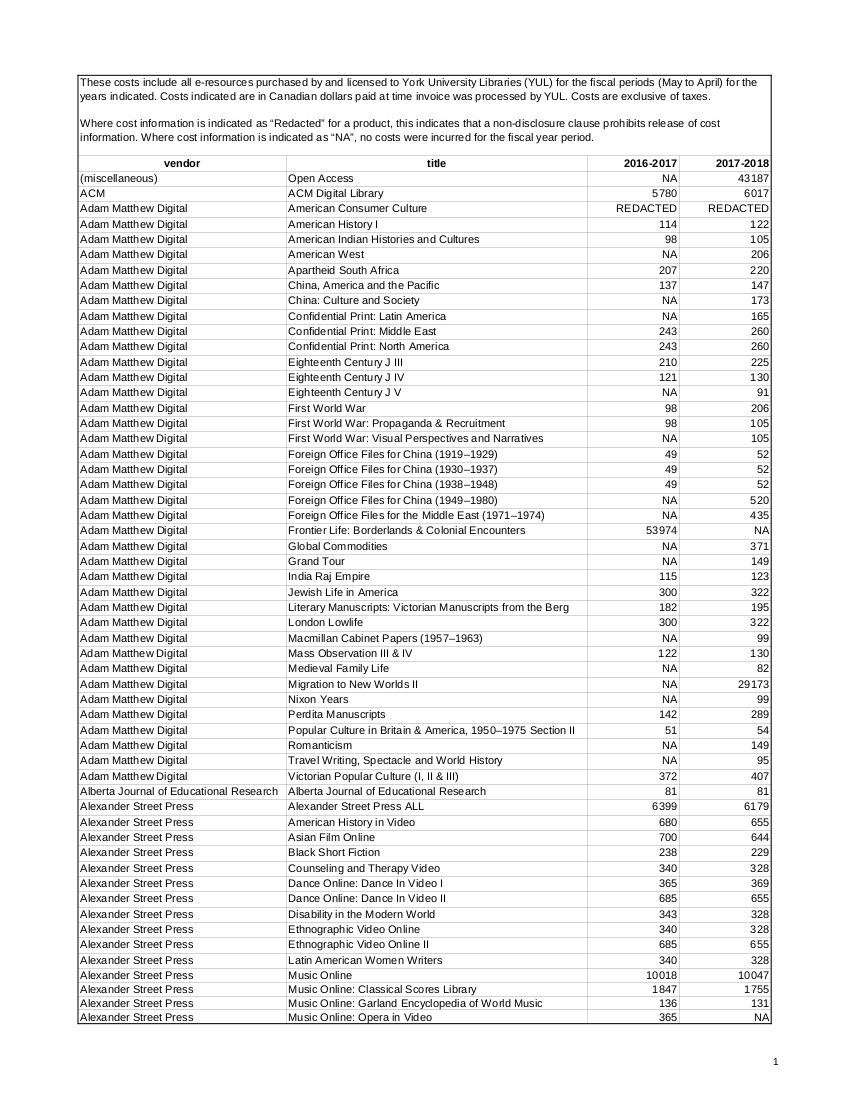
Civilian Bill was very pleased! To Librarian Bill this was nothing new, of course.
Having this PDF made my work a lot easier, because it’s a live PDF with structured data in side it, not just a static image. Whoever got the spreadsheet I had prepared had turned it into a PDF, and all the columns and rows and cells were still in it. The printed version of this PDF on paper would have required a lot of tedious work scanning and OCRing and cleaning.
Of course, you might ask, Why didn’t they send the spreadsheet? Well, they have their processes in the Information and Privacy Office, and if they deal with PDFs, fair enough. The real question is: Why didn’t York University Libraries release this data back in 2017?
I had a PDF containing easily extracted data, which was going to save me a lot of time, and I would work with it.

Starting to extract the data
I thought that pdf2txt would be the easiest way to get the data out. I’d used it before (so I thought) and it had worked well (so I thought). It’s part of the PDFMiner project, but after a bunch of fiddling I couldn’t get beyond it dumping all the data out in one mixed-up column, which was no good.
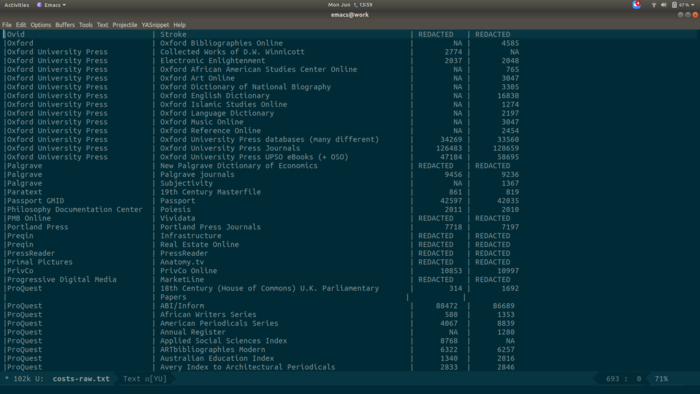
Doing it manually seemed to be the only way. I hoped I could copy and paste column by column from the PDF into a file, but that got messed up on most pages because there were some cells with line breaks that made the selection veer over into the next column right. For example, here I’m selecting the F2017 column (second from right) from the bottom up. All fine so far.
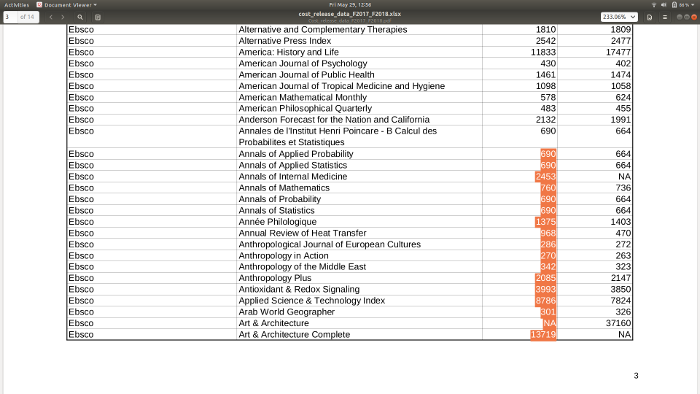
But when I get to the line where the title is on two lines inside its cell, the F2018 column (far right) starts getting picked up instead.
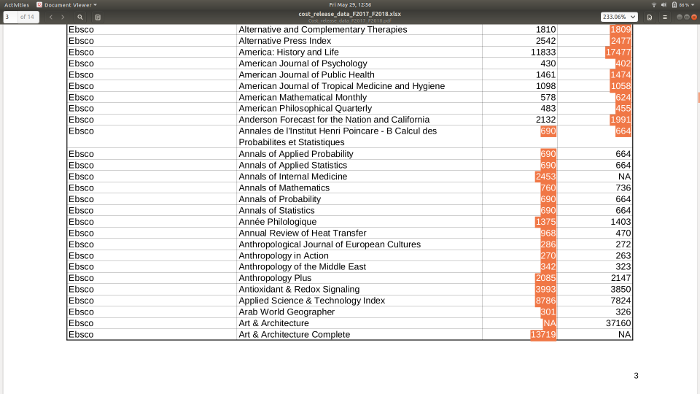
Every time this happened I had to treat the row specially. On some the pages this meant a fair bit of fiddly work. I got six pages done one day then put it aside. (I was doing all this in Emacs and Org, which made the work quick, but wait until you see what happened next.)
The day after next I woke up in the middle of the night and thought, “I should use pdf2txt to pull the data out.” Then I remembered I’d tried it and it hadn’t worked. But something wasn’t right. I knew I’d extracted data from PDFs where the page structure was maintained. Aha! That was with pdftotext, an entirely different program, that is part of Poppler! Yes, it is confusing. I hope no one writes pdf2text or pdftotxt.
pdftotext comes with a -layout option:
Maintain (as best as possible) the original physical layout of the text. The default is to ´undo’ physical layout (columns, hyphenation, etc.) and output the text in reading order.
Here’s what it looks like. Skip past the header and notice in the first attempt there’s just one column of output, while in the second there is structure. (I cleaned up spacing to make it more readable.)
$ pdftotext Cost_release_data_F2017_F2018.pdf
$ head Cost_release_data_F2017_F2018.txt
These costs include all e-resources purchased by and licensed to York University Libraries (YUL) for the fiscal periods (May to April) for the
years indicated. Costs indicated are in Canadian dollars paid at time invoice was processed by YUL. Costs are exclusive of taxes.
Where cost information is indicated as “Redacted” for a product, this indicates that a non-disclosure clause prohibits release of cost
information. Where cost information is indicated as “NA”, no costs were incurred for the fiscal year period.
vendor
(miscellaneous)
ACM
Adam Matthew Digital
Adam Matthew Digital
Adam Matthew Digital
$ pdftotext -layout Cost_release_data_F2017_F2018.pdf
$ head Cost_release_data_F2017_F2018.txt
These costs include all e-resources purchased by and licensed to York University Libraries (YUL) for the fiscal periods (May to April) for the
years indicated. Costs indicated are in Canadian dollars paid at time invoice was processed by YUL. Costs are exclusive of taxes.

Where cost information is indicated as “Redacted” for a product, this indicates that a non-disclosure clause prohibits release of cost
information. Where cost information is indicated as “NA”, no costs were incurred for the fiscal year period.

  vendor              title                      2016-2017   2017-2018
(miscellaneous)       Open Access                       NA       43187
ACM                   ACM Digital Library             5780        6017
Adam Matthew Digital  American Consumer Culture   REDACTED    REDACTED
Now I had a text file with ragged but more or less even columns of data.

Emacs and Org make it easy
I’ve often written about how much I like the text editor Emacs and within it Org mode. (My Emacs configuration files are available if you want to see the details.)
Whenever I’m dealing with text, I use Emacs. If that text (including numbers) is structured as a table, I use Org. Its table editor looks confusing in the documentation, but simple use is a lot easier than it looks, and it’s very powerful and really helpful.
In this case, the best thing about the tables (think: spreadsheets) is that it marks the columns with the pipe symbol (“|”) and if you enter them ragged it will align them to fit. If you start with
|col_one|col_two
|101|202
|808|1000309
And then hit TAB or Ctrl-c, it’ll instantly make it look like this:
| col_one | col_two |
|     101 |     202 |
|     808 | 1000309 |
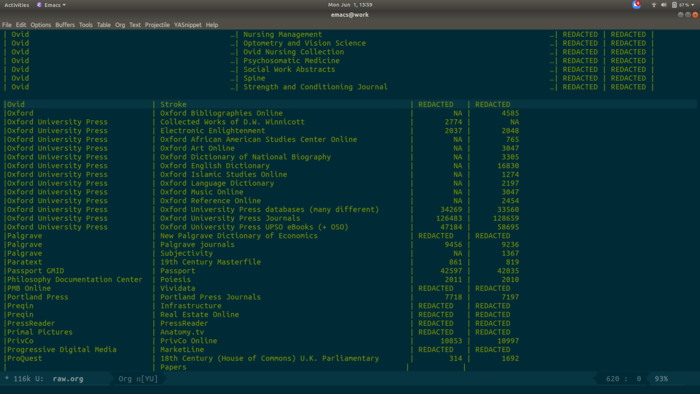
With the output from pdftotext, I had one text file with fourteen sections (one per original page) of somewhat ragged columns of data. I used the Emacs rectangle commands to add columns of pipe symbols into the raw text, then copy the block of ragged text into an Org table, where it would be nicely formatted automatically.
Here’s what it looks like to start.
Here I’ve added four columns of pipes (using C-x <SPC> to go into rectangle mark mode, which is super cool). They don’t all line up, but that’s OK.
Here I paste all that into an Org file. There’s a blank line between this and the nice-looking table above.
I remove the blank line, hit TAB, and it all aligns.
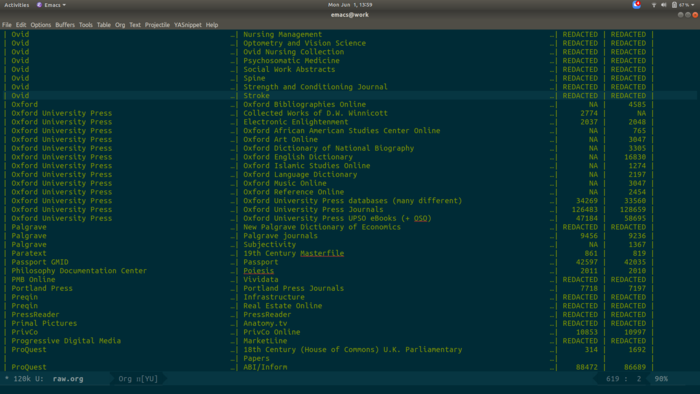
Beautiful! Then I use M-x org-table-export to write all that to a CSV file.
This is more Emacs information than most people need, but I want to show how powerful it is, and that a multipurpose tool like this can make life easier.

Dataverse
Now that the data was extracted, where should it go? Somewhere reliable … somewhere the data would be available forever, or close enough … somewhere not commercial … somewhere affiliated with York. The answer: the Scholars Portal Dataverse. Depositing your data explains how York researchers can use Dataverse. As it happens, the librarian in charge of York’s Dataverse has her office across from me in the library (back when we were in our offices). Minglu Wang asked a couple of questions and then set me up and sent me a long list of great resources about good data practices. She’s an expert on research data management and I strongly recommend anyone at York with data to preserve get in touch with her.
Librarian Bill now have my own dataverse and within it is the “Eresource costs” dataverse at the nice URL https://dataverse.scholarsportal.info/dataverse/eres.

Some analysis
There’s an R Markdown file in the Dataverse that you can load into RStudio or the like, or you can just copy and paste the lines into an R session. (I do my R sessions inside Emacs with ESS and Org, which you probably predicted.) Here’s some of what it has.
First, load in the tidyverse (install it if it’s not already there).
## install.packages("tidyverse")
library(tidyverse)
Now get the data right out of Dataverse (skipping the step where you have to click to agree to abide by the CC BY license, because I haven’t found out how to turn it off):
## Get the data from the CSV.
raw_costs <- read_csv("https://dataverse.scholarsportal.info/api/access/datafile/105969?format=original")

## Turn it into a better (longer) data structure.
## Replace all NAs with 0s while we're at it.
costs <- raw_costs %>%
  pivot_longer(c("F2017", "F2018"), names_to = "year", values_to = "cost") %>%
  replace_na(list(cost = 0))

## Pick out all the products where the cost is known.
costs_known <- costs %>%
  filter(! cost == "REDACTED") %>%
  mutate(cost = as.numeric(cost))
This takes the “wide” format of the original data and makes it “long” and tidy. Notice how instead of “F2017” and “F2018” columns there’s one column with “year” that has the values of either 2017 or 2018.
ℝ> costs
# A tibble: 1,722 x 4
   vendor               title                                  year  cost
   <chr>                <chr>                                  <chr> <chr>
 1 (miscellaneous)      Open Access                            F2017 0
 2 (miscellaneous)      Open Access                            F2018 43187
 3 ACM                  ACM Digital Library                    F2017 5780
 4 ACM                  ACM Digital Library                    F2018 6017
 5 Adam Matthew Digital American Consumer Culture              F2017 REDACTED
 6 Adam Matthew Digital American Consumer Culture              F2018 REDACTED
 7 Adam Matthew Digital American History I                     F2017 114
 8 Adam Matthew Digital American History I                     F2018 122
 9 Adam Matthew Digital American Indian Histories and Cultures F2017 98
10 Adam Matthew Digital American Indian Histories and Cultures F2018 105
With this in hand, we can make a chart showing the vendors paid over $100,000 (Canadian).
## Short list of vendors where YUL spent the most.
major_amount <- 100000
major_amount_pretty <- format(major_amount, big.mark = ",", scientific = FALSE)

major_vendors <- total_vendor_costs %>% filter(total > major_amount) %>% pull(vendor) %>% unique()

major_vendor_costs <- total_vendor_costs %>% filter(vendor %in% major_vendors)

## The reorder function sorts the vendor list by total costs, which
## makes the chart much more readable.
## coord_flip() helps make this kind of chart more readable.

major_vendor_costs %>%
    ggplot(aes(x = reorder(vendor, total), y = total / 1000, fill = year)) +
    geom_col(position = "dodge") +
    geom_label(aes(label = round(total / 1000, -1)),
               position = position_dodge(0.9),
               show.legend = FALSE) +
    coord_flip() +
    labs(title = paste0("York University Libraries eresource costs: vendors paid over $", major_amount_pretty, " total"),
         subtitle = "Does not include all costs because some were redacted",
         x = "",
         y = "$000 (rounded)",
         fill = "",
         caption = "William Denton <wdenton@yorku.ca>, CC BY") +
    theme_minimal()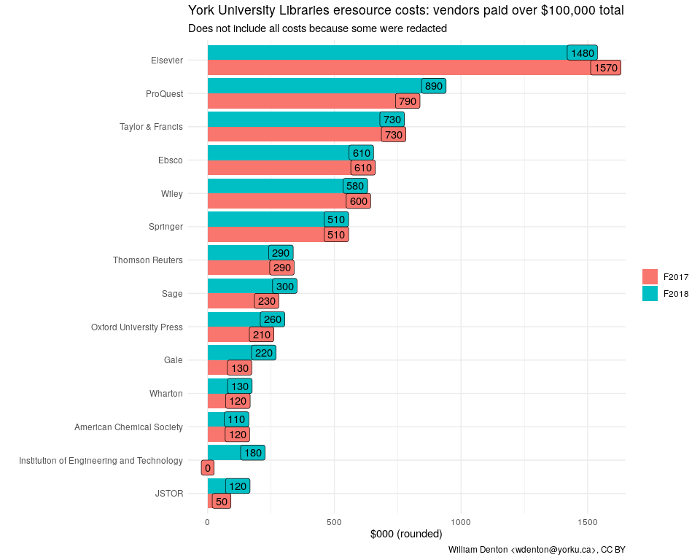
In F2018 we know the Libraries paid Elsevier about $1.57 million. And that’s not including the sixteen products where the prices were redacted! The most expensive product was ScienceDirect—no surprise—at about $1.4 million. The Elsevier F2018 annual report says it had an “adjusted operating profit margin” of 31.3% that year—yes, 31.3%—so of that $1.57 million that we know, $491,000 was pure profit for the company. The Libraries’ collections budget is (in this fiscal year) on the order of $13 million. That means close to 4% of the collections budget goes straight to Elsevier profit.
This is an example of a major issue in scholarly publishing. See SPARC’s Big Deal Cancellation Tracking for more about all this.
Here’s a chart counting redactions by vendor:
costs_redacted <- costs %>% filter(cost == "REDACTED")

costs_redacted %>%
    count(vendor, year) %>%
    ggplot(aes(x = reorder(vendor, n), y = n, fill = year)) +
    geom_col(position = "dodge") +
    coord_flip() +
    labs(title = "York University Libraries eresource costs: vendors with redacted costs",
         subtitle = "Count of products where costs were redacted because of vendor license restrictions",
         x = "",
         y = "$000",
         fill = "",
         caption = "William Denton <wdenton@yorku.ca>, CC BY") +
    theme_minimal()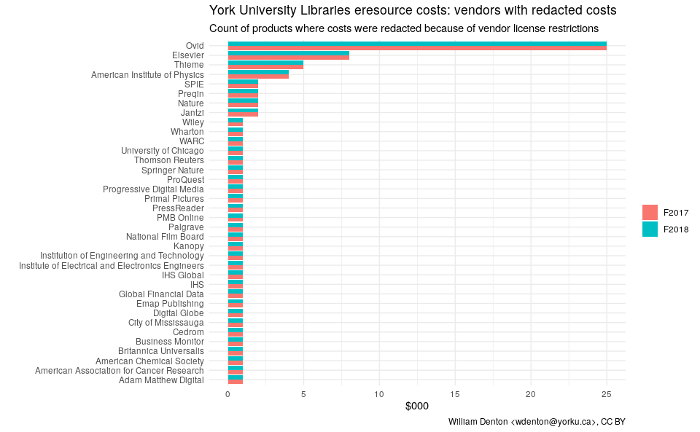

Why the redactions?
Because I thought it would make things go faster to ask for costs where there was no non-disclosure agreement. It didn’t. Along the way I learned that FIPPA doesn’t care about non-disclosure agreements in contracts. But my original request was for costs that didn’t have an NDA, and I let it ride.

What next?
I’m going to file for the eresource costs for F2019 and F2020, of course. With no redactions.
