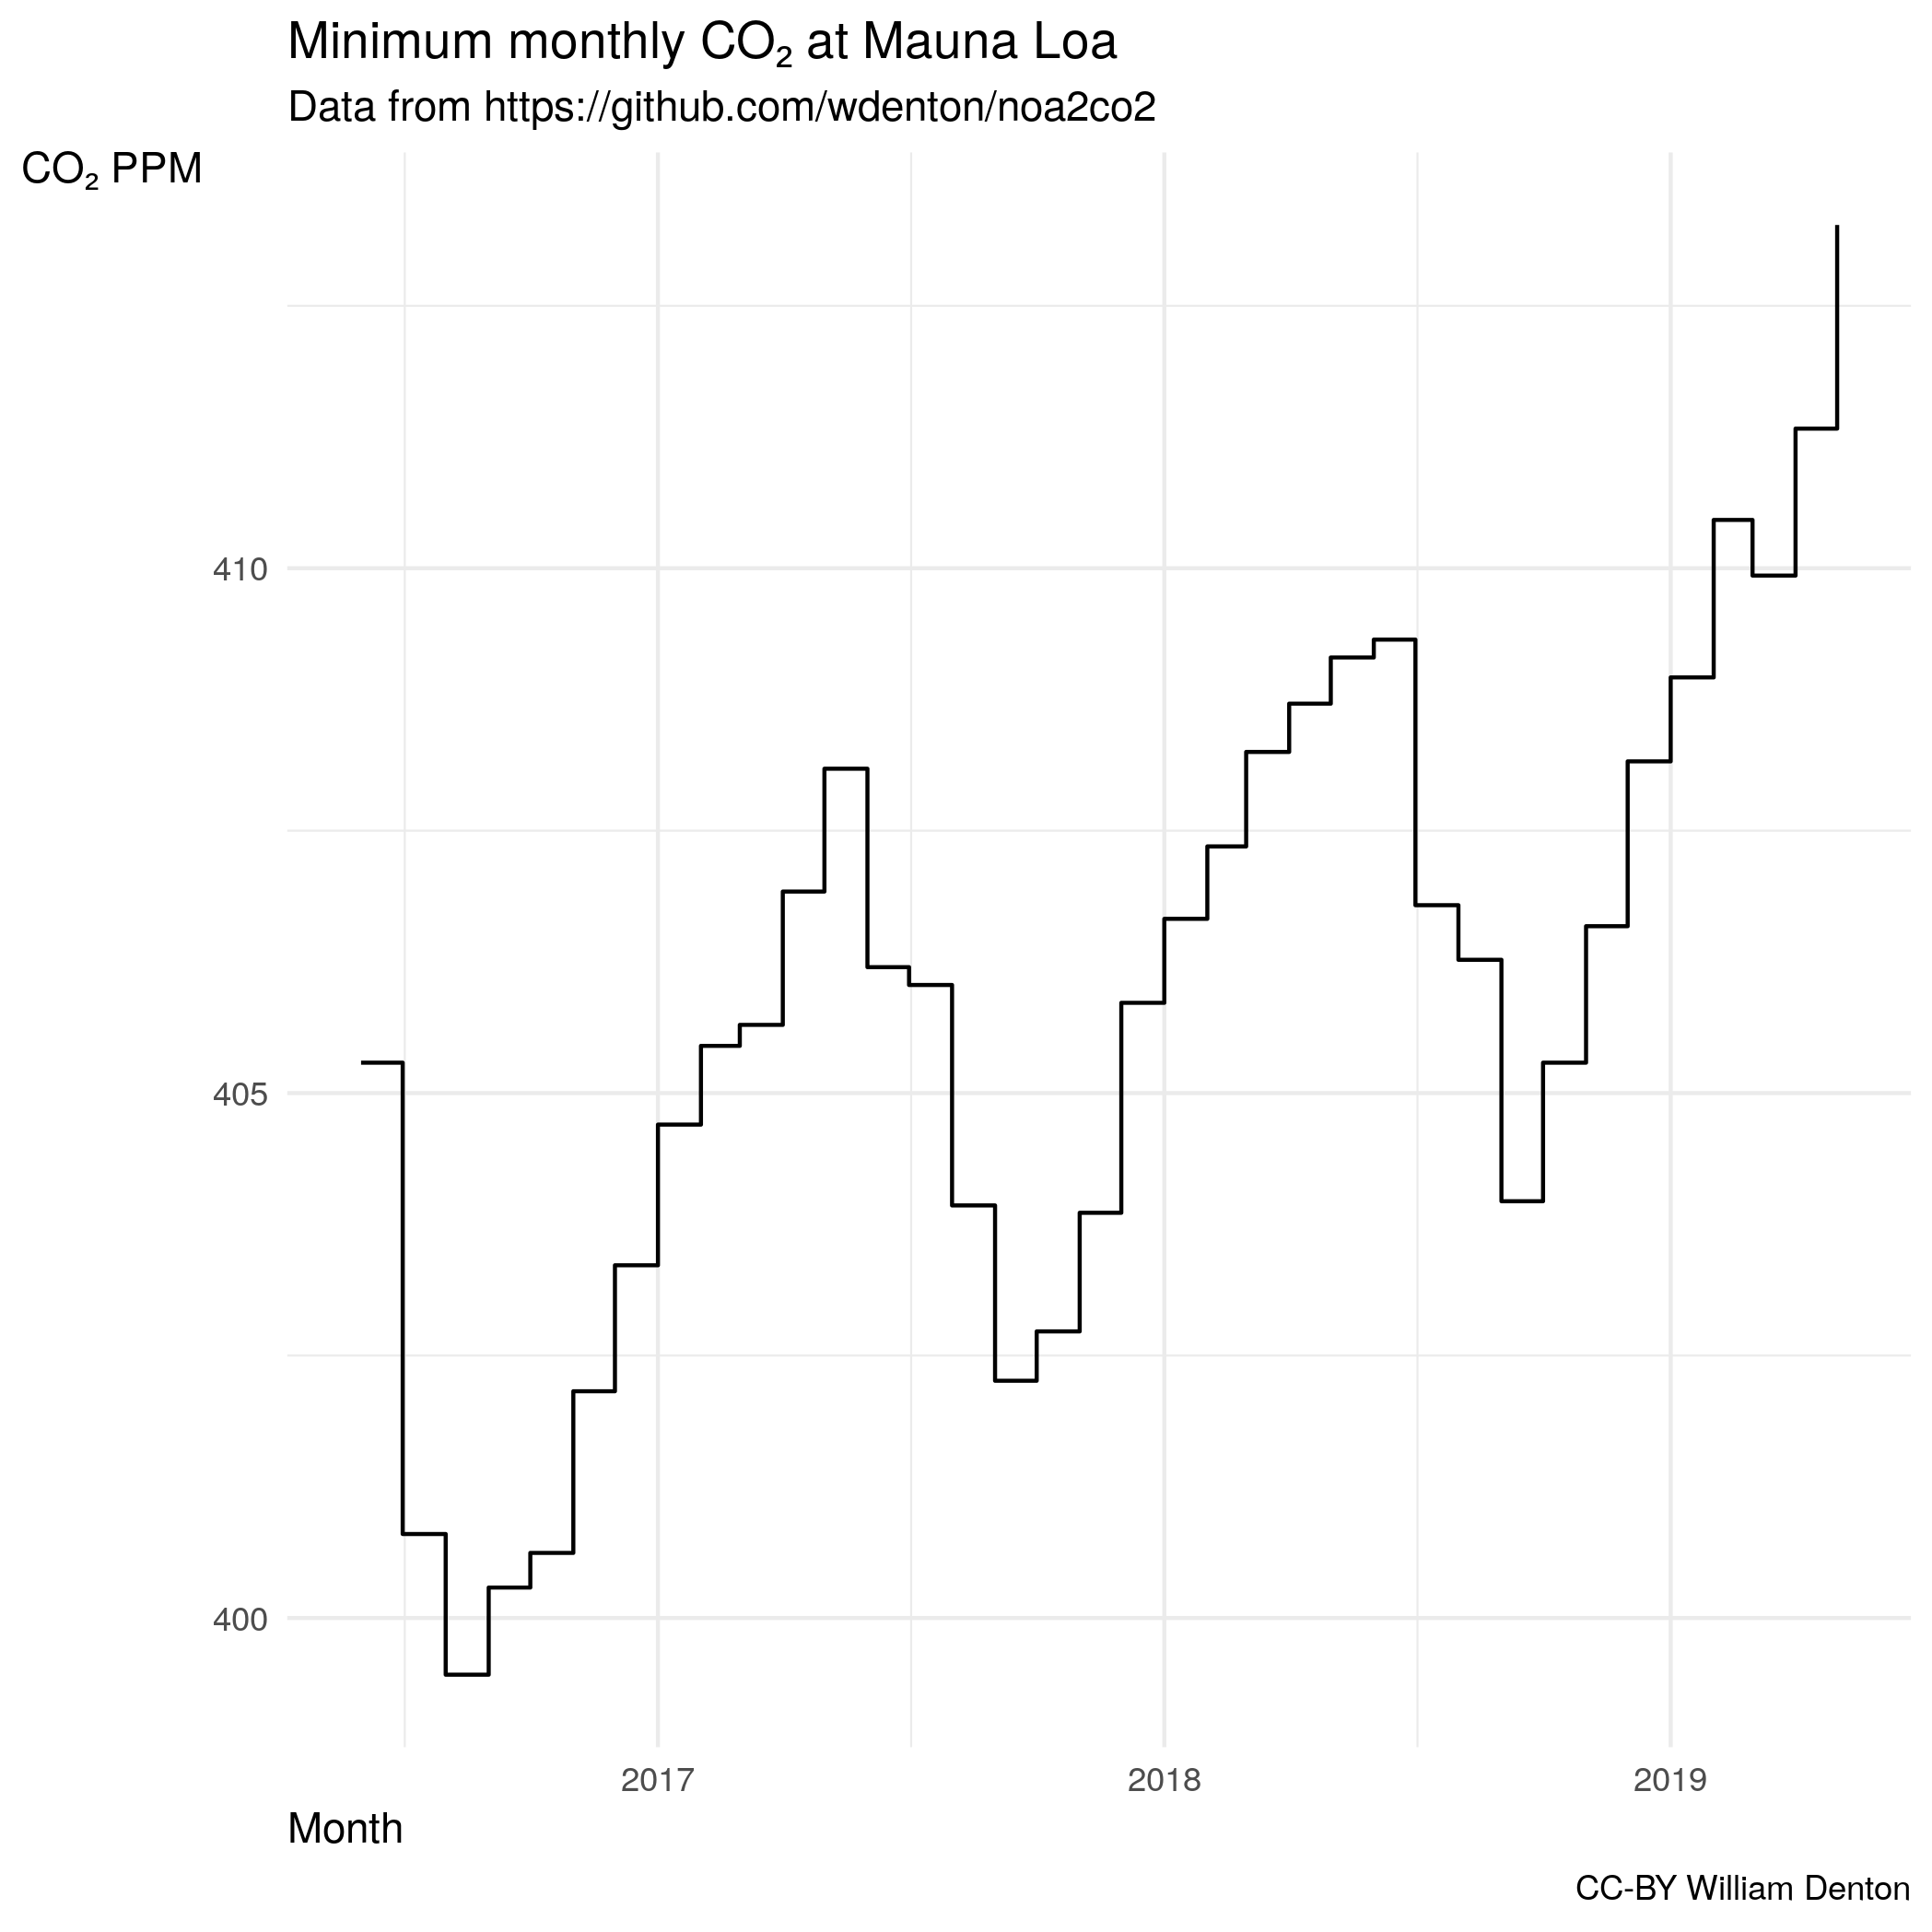
ℝ>library(tidyverse)ℝ>library(lubridate)ℝ>library(ggplot2)ℝ>read_csv("https://raw.githubusercontent.com/wdenton/noa2co2/master/mauna-loa.csv",col_names=c("date","co2"))%>%mutate(month=floor_date(date,unit="month"))%>%group_by(month)%>%slice(which.min(co2))%>%ggplot(aes(x=month,y=co2))+geom_step()+labs(title="Minimum monthly CO₂ at Mauna Loa",x="Month",y="CO₂ PPM",subtitle="Data from https://github.com/wdenton/noa2co2",caption="CC-BY William Denton")+theme_minimal()+theme(axis.title.y=element_text(angle=0),axis.title.x=element_text(hjust=0))