In Org clocktables I: The daily structure I explained how I track my time working at an academic library, clocking in to projects that are either categorized as PPK (“professional performance and knowledge,” our term for “librarianship,”), PCS (“professional contributions and standing”, which covers research, professional development and the like) and Service. I do this by checking in and out of tasks with the magic of Org.
I’ll add a day to the example I used before, to make it more interesting. This is what the raw text looks like:
* 2017-12 December

** [2017-12-01 Fri]
:LOGBOOK:
CLOCK: [2017-12-01 Fri 09:30]--[2017-12-01 Fri 09:50] =>  0:20
CLOCK: [2017-12-01 Fri 13:15]--[2017-12-01 Fri 13:40] =>  0:25
:END:

*** PPK

**** Libstats stuff
:LOGBOOK:
CLOCK: [2017-12-01 Fri 09:50]--[2017-12-01 Fri 10:15] =>  0:25
:END:

Pull numbers on weekend desk activity for A.

**** Ebook usage
:LOGBOOK:
CLOCK: [2017-12-01 Fri 13:40]--[2017-12-01 Fri 16:30] =>  2:50
:END:

Wrote code to grok EZProxy logs and look up ISBNs of Scholars Portal ebooks.

*** PCS

*** Service

**** Stewards' Council meeting
:LOGBOOK:
CLOCK: [2017-12-01 Fri 10:15]--[2017-12-01 Fri 13:15] =>  3:00
:END:

Copious meeting notes here.

** [2017-12-04 Mon]
:LOGBOOK:
CLOCK: [2017-12-04 Mon 09:30]--[2017-12-04 Mon 09:50] =>  0:20
CLOCK: [2017-12-04 Mon 12:15]--[2017-12-04 Mon 13:00] =>  0:45
CLOCK: [2017-12-04 Mon 16:00]--[2017-12-04 Mon 16:15] =>  0:15
:END:

*** PPK

**** ProQuest visit
:LOGBOOK:
CLOCK: [2017-12-04 Mon 09:50]--[2017-12-04 Mon 12:15] =>  2:25
:END:

Notes on this here.

**** Math print journals
:LOGBOOK:
CLOCK: [2017-12-04 Mon 16:15]--[2017-12-04 Mon 17:15] =>  1:00
:END:

Check current subs and costs; update list of print subs to drop.

*** PCS

**** Pull together sonification notes
:LOGBOOK:
CLOCK: [2017-12-04 Mon 13:00]--[2017-12-04 Mon 16:00] =>  3:00
:END:

*** Service
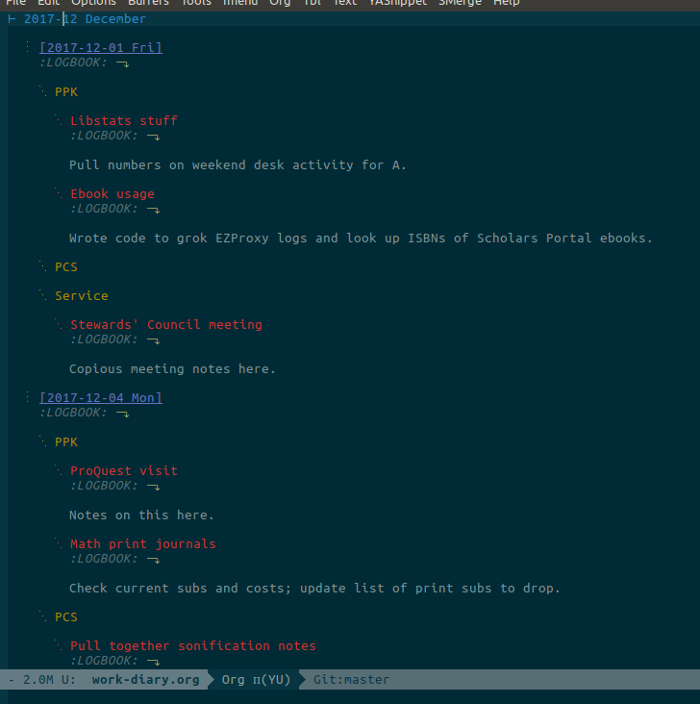
All raw Org text looks ugly, especially all those LOGBOOK and PROPERTIES drawers. Don’t let that put you off. This is what it looks like on my screen with my customizations (see my .emacs for details):

At the bottom of the month I use Org’s clock table to summarize all this.
#+BEGIN: clocktable :maxlevel 3 :scope tree :compact nil :header "#+NAME: clock_201712\n"
#+NAME: clock_201712
| Headline             | Time  |      |      |
|----------------------+-------+------+------|
| *Total time*           | *14:45* |      |      |
|----------------------+-------+------+------|
| 2017-12 December     | 14:45 |      |      |
| \_  [2017-12-01 Fri] |       | 7:00 |      |
| \_    PPK            |       |      | 3:15 |
| \_    Service        |       |      | 3:00 |
| \_  [2017-12-04 Mon] |       | 7:45 |      |
| \_    PPK            |       |      | 3:25 |
| \_    PCS            |       |      | 3:00 |
#+END
I just put in the BEGIN/END lines and then hit C-c C-c and Org creates that table. Whenever I add some more time, I can position the pointer on the BEGIN line and hit C-c C-c and it updates everything.
Now, there are lots of commands I could use to customize this, but this is pretty vanilla and it suits me. It makes it clear how much time I have down for each day and how much time I spent in each of the three pillars. It’s easy to read at a glance. I fiddled with various options but decided to stay with this.
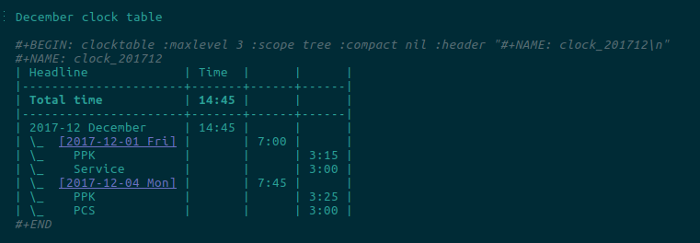
It looks like this on my screen:

That’s a start, but the data is not in a format I can use as is. The times are split across different columns, there are multiple levels of indents, there’s a heading and a summation row, etc. But! The data is in a table in Org, which means I can easily ingest it and process it in any language I choose, in the same Org file. That’s part of the power of Org: it turns raw data into structured data, which I can process with a script into a better structure, all in the same file, mixing text, data and output.
Which language, though? A real Emacs hacker would use Lisp, but that’s beyond me. I can get by in two languages: Ruby and R. I started doing this in Ruby, and got things mostly working, then realized how it should go and what the right steps were to take, and switched to R.
Here’s the plan:
- ignore “Headline” and “Total time” and “2017-12 December” … in fact, ignore everything that doesn’t start with “\_”
- clean up the remaining lines by removing “\_”
- the first line will be a date stamp, with the total day’s time in the first column, so grab it
- after that, every line will either be a PPK/PCS/Service line, in which case grab that time
- or it will be a new date stamp, in which case capture that information and write out the previous day’s information
- continue on through all the lines
- until the end, at which point a day is finished but not written out, so write it out
I did this in R, using three packages to make things easier. For managing the time intervals I’m using hms, which seems like a useful tool. It needs to be a very recent version to make use of some time-parsing functions, so it needs to be installed from GitHub. Here’s the R:
library(tidyverse)
library(hms) ## Right now, needs GitHub version
library(stringr)
clean_monthly_clocktable <- function (raw_clocktable) {
  ## Clean up the table into something simple
  clock <- raw_clocktable %>% filter(grepl("\\\\_", Headline)) %>% mutate(heading = str_replace(Headline, "\\\\_ *", "")) %>% mutate(heading = str_replace(heading, "] .*", "]")) %>% rename(total = X, subtotal = X.1) %>% select(heading, total, subtotal)

  ## Set up the table we'll populate line by line
  newclock <- tribble(~date, ~ppk, ~pcs, ~service, ~total)

  ## The first line we know has a date and time, and always will
  date_old <- substr(clock[1,1], 2, 11)
  total_time_old <- clock[1,2]
  date_new <- NA
  ppk <- pcs <- service <- vacation <- total_time_new <- "0:00"

  ## Loop through all lines ...
  for (i in 2:nrow(clock)) {
    if      (clock[i,1] == "PPK")     { ppk      <- clock[i,3] }
    else if (clock[i,1] == "PCS")     { pcs      <- clock[i,3] }
    else if (clock[i,1] == "Service") { service  <- clock[i,3] }
    else {
     date_new <- substr(clock[i,1], 2, 11)
     total_time_new <- clock[i,2]
    }
    ## When we see a new date, add the previous date's details to the table
    if (! is.na(date_new)) {
     newclock <- newclock %>% add_row(date = date_old, ppk, pcs, service, total = total_time_old)
     ppk <- pcs <- service <- "0:00"
     date_old <- date_new
     date_new <- NA
     total_time_old <- total_time_new
    }
  }

  ## Finally, add the final date to the table, when all the rows are read.
  newclock <- newclock %>% add_row(date = date_old, ppk, pcs, service, total = total_time_old)
  newclock <- newclock %>% mutate(ppk = parse_hm(ppk), pcs = parse_hm(pcs), service = parse_hm(service), total = parse_hm(total), lost = as.hms(total - (ppk + pcs + service))) %>% mutate(date = as.Date(date))
}
All of that is in a SRC block like below, but I separated the two in case it makes the syntax highlighting clearer. I don’t think it does, but such is life. Imagine the above code pasted into this block:
#+BEGIN_SRC R :session :results values

#+END
Running C-c C-c on that will produce no output, but it does create an R session and set up the function. (Of course, all of this will fail if you don’t have R (and those three packages) installed.)
With that ready, now I can parse that monthly clocktable by running C-c C-c on this next source block, which reads in the raw clock table (note the var setting, which matches the #+NAME above), parses it with that function, and outputs cleaner data. I have this right below the December clock table.
#+BEGIN_SRC R :session :results values :var clock_201712=clock_201712 :colnames yes
clean_monthly_clocktable(clock_201712)
#+END_SRC

#+RESULTS:
|       date |      ppk |      pcs |  service |    total |     lost |
|------------+----------+----------+----------+----------+----------|
| 2017-12-01 | 03:15:00 | 00:00:00 | 03:00:00 | 07:00:00 | 00:45:00 |
| 2017-12-04 | 03:25:00 | 03:00:00 | 00:00:00 | 07:45:00 | 01:20:00 |
This is tidy data. It looks this this:

That’s what I wanted. The code I wrote to generate it could be better, but it works, and that’s good enough.
Notice all of the same dates and time durations are there, but they’re organized much more nicely—and I’ve added “lost.” The “lost” count is how much time in the day was unaccounted for. This includes lunch (maybe I’ll end up classifying that differently), short breaks, ploughing through email first thing in the morning, catching up with colleagues, tidying up my desk, falling into Wikipedia, and all those other blocks of time that can’t be directly assigned to some project.
My aim is to keep track of the “lost” time and to minimize it, by a) not wasting time and b) properly classifying work. Talking to colleagues and tidying my desk is work, after all. It’s not immortally important work that people will talk about centuries from now, but it’s work. Not everything I do on the job can be classified against projects. (Not the way I think of projects—maybe lawyers and doctors and the self-employed think of them differently.)
The one technical problem with this is that when I restart Emacs I need to rerun the source block with the R function in it, to set up the R session and the function, before I can rerun the simple “update the monthly clocktable” block. However, because I don’t restart Emacs very often, that’s not a big problem.
The next stage of this is showing how I summarize the cleaned data to understand, each month, how much of my time I spent on PPK, PCS and Service. I’ll cover that in another post.
 Miskatonic University Press