I updated my jekyll-co2 plugin (first written about here) that shows the change in atmospheric CO₂ at the Mauna Loa observatory in Hawaii. It used to just show three years of data as numbers, but now it shows 20 years in a little text (Unicode) sparkline. In text, it’s this: ▁▁▂▂▂▂▃▃▃▄▄▄▅▅▅▅▆▆▆▇▇.
Graphically, it’s this:
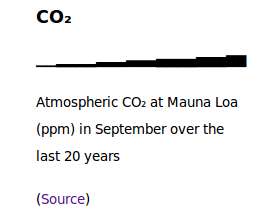
If you hover over a year it shows the exact number in a tooltip. The preventable but unstopping increase is what I want to show, though, and in plain (Unicode) text I think that comes across even without obvious numbers.
I got the mechanism from a nice hack in this gist. I’d like to do more years in a prettier sparkline, but that would require some outside graphical library, and I don’t feel like getting into that right now.