If you use the augmented reality application Layar then you may be interested in Avoirdupois, a point of interest (POI) provider I’ve made. Avoirdupois provides the fairly simple web service that Layar needs so that it can show users POIs near where they are. It’s written in Ruby and uses the Sinatra web application framework. If you have a set of geolocated points and want to present them in an augmented reality app, this will do it.
The README has all the instructions you need to download it and try it out, assuming you’re OK at the command line and have some basic Git and Ruby skills. You should be able to copy and paste the commands in the README and make everything on your local machine. Deploying it in production is more advanced but not that much more. If I can do it, so can you.
I’m running two layers with it right now, and I have at least one more to add soon:
- York University, Toronto (AR-enhanced view of York’s two campuses)
- YU Alternative Campus Tour (which goes with the Alternative Campus Tour of York University in Toronto; not much content)
Below is what the York layer looks like (in a slightly older version of Layar). I grabbed this screenshot on the York campus while pointing my phone towards the Scott Library, a big Brutalist thing like so many other 1960s libraries. Layar is floating an image of Scott in midair, overtop of the real library in the camera view (notice the tree and sky in the background), and at the bottom is some information about the building.

If you’re curious about what Avoirdupois actually does, here’s an example of the JSON it gives out if you ask it for points of interest in this layer, as required by Layar’s GetPOIs Response documentation:
{
  "layer": "yorkuniversitytoronto",
  "showMessage": "Filters are available through Layer Actions in settings.",
  "refreshDistance": 100,
  "refreshInterval": 300,
  "hotspots": [
    {
      "id": 113,
      "text": {
        "title": "York – Village West Shuttle",
        "description": "",
        "footnote": ""
      },
      "anchor": {
        "geolocation": {
          "lat": 43.7731,
          "lon": -79.5032
        }
      },
      "imageURL": "http://www.yorku.ca/web/css/yeb11yorklogo.gif",
      "biwStyle": "collapsed",
      "showSmallBiw": true,
      "showBiwOnClick": true,
      "actions": [],
      "icon": {
        "url": "http://avoirdupois.miskatonic.org/icons/yorkuniversitytoronto/york-ciw-110x110.png",
        "type": 0
      }
    },
Layar takes that and turns it into what you saw in the screenshot.
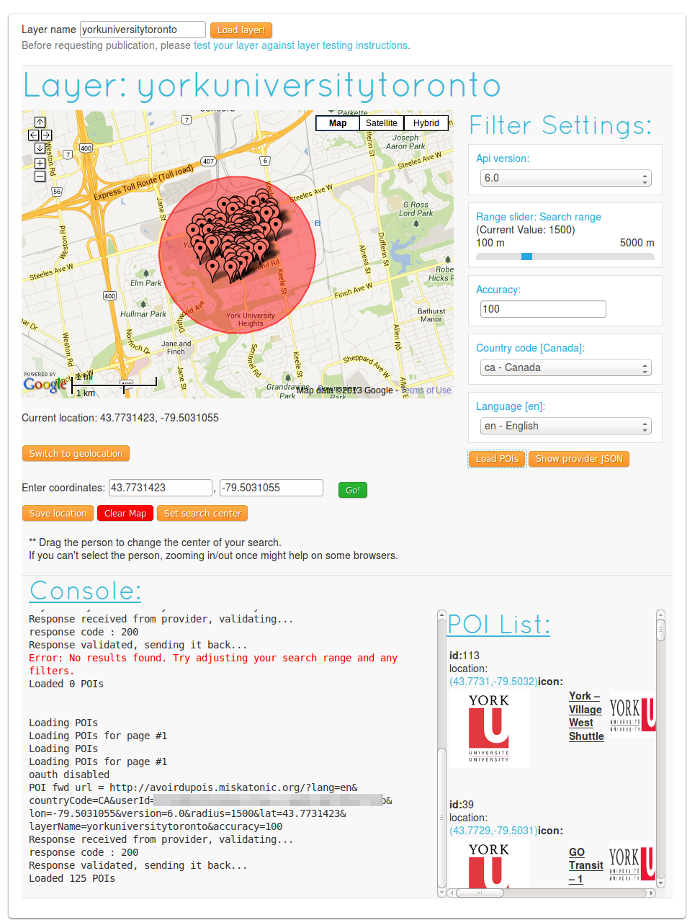
Here’s a screenshot of the Layar test page for this layer, where I’ve picked a point on the York campus and have it query Avoirdupois to make sure everything works properly. If you set up something in Layar you’ll spend a little while, but not too long, on pages like that, tinkering with things to get it working, but it’s not hard.

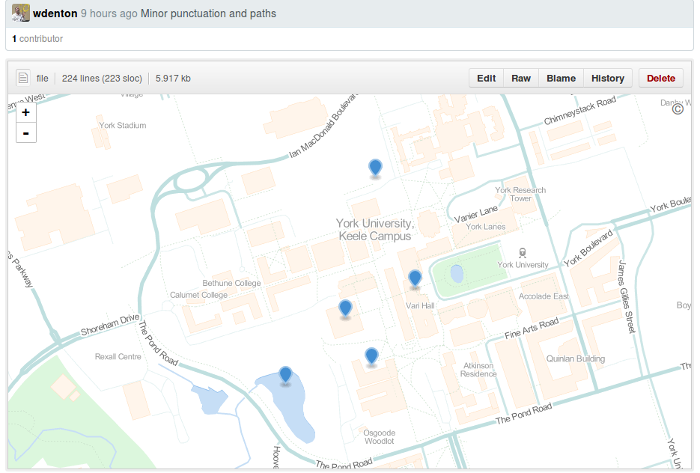
Static sets of points of interest are set up in a GeoJSON file. That’s not hard to do, and an advantage of using GitHub is that you can view the information as a map, and edit it, right in your browser:
You run a Ruby script to load the GeoJSON config file into the Avoirdupois database and then everything should just work.
There are many things to be done with Avoirdupois that would make it better right away (such as tests—there are no tests!). This is not beautiful code, but it works, and it might be useful. If you want to contribute you’d be welcome. One of my plans is to look at extending it so it can drive geolocated channels in Wikitude and Junaio, which would mean you could serve up the same data in all three apps without doing any special work.
Or serve it up in other apps. I used GeoJSON for the POI configurations because it’s easy to manage and easy to reuse. I want to present useful information in an augmented reality view through Layar and other apps … but a fundamental point in all of this is that the data should be usable for other purposes and presentable in other ways.
The code isn’t complicated, and you’re welcome to rip out bits of it for your own purposes if it’s at all useful. When I had the Ruby in place to generate the right JSON I reused it for Laertes, which gathers together geolocated tweets using a defined hash tag with points of interest from Google Maps to give an AR view of goings on and happenings for everyone at an event or conference. (I posted about Laertes here and here.)
 Miskatonic University Press
