I really admire what Tony Hirst does at OUseful.Info, the blog. If you don’t know of him, go have a look, and perhaps follow him on Twitter at @psychemedia.
In February he did one of his usual lengthy, richly informative, visually striking, thought-provoking posts called Visualising Activity Around a Twitter Hashtag or Search Term Using R. I’d filed this away as something worth trying and since I’m taking a short break at Great Lakes THAT Camp 2012 I thought I’d try what he did on the #thatcamp hashtag on Twitter. It’s complicated by the fact that there are two THAT Camps going on simultaneously, but let’s see what happens.
What I do is all copied from what Tony did, except that I decided not to use ggplot, only because I’ve never used it before. I ran R and did:
> install.packages("twitteR")
> library(twitteR)
> library(plyr)
> tweets <- searchTwitter("#thatcamp", n=500) # do a search
> tw <- twListToDF(tweets) # turn results into a data frame
> colnames(tw)
 [1] "text"         "favorited"    "replyToSN"    "created"      "truncated"    "replyToSID"   "id"
 [8] "replyToUID"   "statusSource" "screenName"
> # Find the earliest tweet for each user
> tw1 <- ddply(tw, .var = "screenName", .fun = function(x) {return(subset(x, created %in% min(created),select=c(screenName,created)))})
> colnames(tw1)
[1] "screenName" "created"
> head(tw1)
     screenName             created
1     _amytyson 2012-04-18 19:26:40
2     acavender 2012-04-19 12:12:12
3   acrlulstech 2012-04-20 16:57:39
4   adamarenson 2012-04-18 17:22:58
5 adamkriesberg 2012-04-17 20:44:28
6    adelinekoh 2012-04-21 14:10:00
> # Arrange usernames in order of first tweet time
> tw2 <- arrange(tw1, -desc(created))
> head(tw2)
       screenName             created
1    foundhistory 2012-04-16 14:43:56
2        thatcamp 2012-04-16 14:47:18
3  THATCampCaribe 2012-04-16 15:32:11
4       PhDeviate 2012-04-16 15:36:52
5       nickmimic 2012-04-16 15:59:19
6 AfrolatinProjec 2012-04-16 16:14:07
> # Now use this order to reorder our original tw dataframe
> tw$screenName <- factor(tw$screenName, levels = tw2$screenName)
> png(filename = "20120421-thatcamp-tweets.png", height=1000, width=500)
> plot(tw$created, tw$screenName, xlab = "Time",
  ylab = "Username",
  main = "Last 500 #thatcamp tweets as of Sat 21 Apr 2012", yaxt="n")
> # Label the y-axis nicely, hope it's readable
> axis(2, at = 1:length(levels(tw$screenName)), labels=levels(tw$screenName), las=2, cex.axis=0.4)
> dev.off()
That generates this image, which puts a dot to indicate who tweeted when with the #thatcamp hashtag.
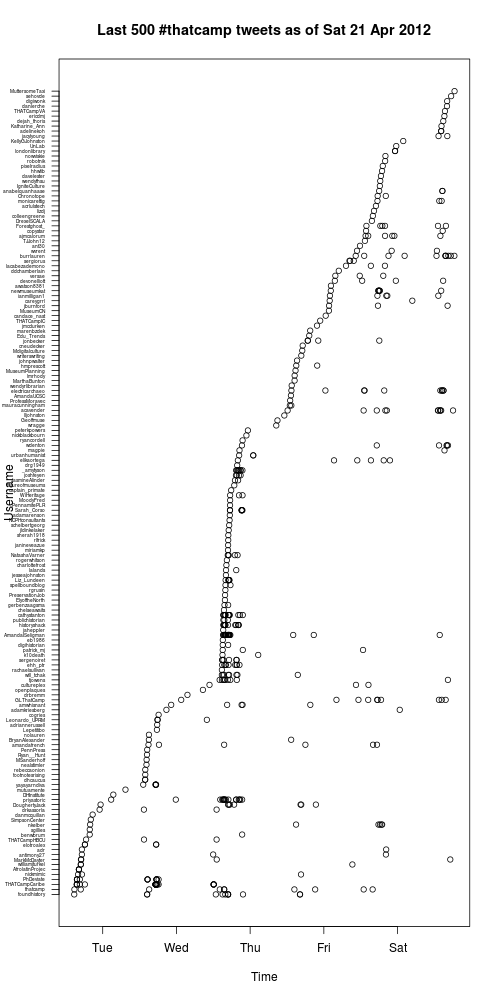
Not as pretty as what Tony did, but it’s a start.