Geolocation
I didn’t know anything much about browser-based geolocation before today, but here are a few things I found out, which I’ll note for my own reference.
First: an example! (Which may not work, depending on various things about which browser you’re using and what your privacy settings are, but if it doesn’t work, don’t ask me, ‘cause I don’t know.)
(If everything is configured right.)
If you like that wee marvel, try Ed Summers’s Creepy Polaroid. You just look at the page and it shows you a weird-looking Polaroid of where you are! Creepy all right. (Don’t worry, Ed isn’t watching you. View the source of the page to see how he does it—if you program a bit, it’s easy enough to read and see how he’s grabbing an image from Google Maps.)
Here’s the official specification for how all this “where am I” works: the W3C Geolocation API. It’s technical, but short. The use cases for why a browser should be able to find out where the user is are good:
- Find points of interest in the user’s area
- Annotating content with location information
- Show the user’s position on a map
- Turn-by-turn route navigation
- Alerts when points of interest are in the user’s vicinity
- Up-to-date local information
- Location-tagged status updates in social networking applications
All very sensible.
My preferred browser is Firefox. Here’s how geolocation works in Firefox—this is Firefox’s implementation of the W3C specification:
Getting the current position
To obtain the user’s current location, you can call the getCurrentPosition() method. This initiates an asynchronous request to detect the user’s position, and queries the positioning hardware to get up-to-date information.
But how is Firefox getting the actual location? Does it know itself? No, it asks Google:
Gecko notes
Firefox includes support for locating you based on your WiFi information using Google Location Services. In the transaction between Firefox and Google, data is exchanged including WiFi Access Point data, an access token (similar to a 2 week cookie), and the user’s IP address. For more information, please check out Mozilla’s Privacy Policy and Google’s Privacy Policy covering how this data can be used.
The Mozilla policy has lots of detail on how Firefox respects privacy with regard to location, including:
If your computer or device has a GPS unit or your operating system provides geolocation services and you have elected to use the location aware feature, Firefox will send your location information directly to the requesting website. If not, Firefox will send the other information described above, plus your user agent information (e.g., version of Firefox you’re using) and a temporary client identifier, to a third party geolocation services provider. That provider can determine your approximate location from such data (e.g., convert a set of WiFi signal strengths into latitude and longitude). This information is sent by Firefox over an encrypted connection and no cookies are used. Neither the domain name nor the URL of the site you’re visiting is sent to our service providers. Our providers estimate your location and return it to Firefox. Firefox provides your location information to the webpage that made the request.
Fair enough. Google’s got all the information, and they make it easy to use. Of course they do! They want all the data they can get, and the more they know about where people are, the better.
(Funny thing about Google’s policy. I use HTTPS Everywhere, which makes Firefox load the HTTPS version of a page wherever it can. Good security precaution. But on Google’s site, the HTTP version of the privacy policy can be loaded, but not the HTTPS version! My browser automatically takes me to the HTTPS version and then fails. Strange that a privacy policy can’t be read over an encrypted link.)
Of course, we should all assume that spy agencies like the NSA and CSEC are tracking our movements and can figure out where our smartphone was at any time. Not much I can do about that. Not much I can do about Google without giving up my phone. I do what I can to not run shifty apps that track my location, though, like that ridiculous flashlight app. I don’t think Google’s privacy policy really means anything.
Some good news is that Mozilla, a more trustworthy organization, is building their own system to geolocate people and browsers: Location Service.
The “Mozilla Location Service” project is a pilot project to assess the impact Mozilla can have on the geolocation landscape, specifically to improve user privacy and enable innovation by creating public data sets. In order to do this assessment, we need to understand the technological and legal challenges. Therefore, the Cloud Services team will build and operate a location service to provide geolocation lookup for devices, based on for example cell tower and Wi-Fi data.
Geolocation lookup is a very useful service to provide to users. None of the current companies offering this type of service have any incentive to improve on privacy. Geolocation lookup and the potential for tracking the physical movement of individuals is a serious privacy issue.
They made an Android app called MozStumbler. You can download a release and install it (if you run Android). I ran it while I was walking around my neighbourhood, and it told me it had seen dozens of cell phone towers and hundreds of wifi access points, all of which it reported back to its central system. That system is building up a big database of information of what is where, and it’s already usable: API - Geolocate is a service to “determine the current location based on provided data about nearby cell towers or wifi base stations.”
You can adjust your Firefox configuration to use this service instead of Google. As they say,
You can point your Firefox Desktop browser version 24 or later at this service by changing the geo.wifi.uri setting in about:config to:
https://location.services.mozilla.com/v1/geolocate?key=<API_KEY>
My geo.wifi.uri setting was
https://www.googleapis.com/geolocation/v1/geolocate?key=%GOOGLE_API_KEY%
but I changed it (but going to about:config and editing) to the Mozilla service. I’ll see how it goes. I don’t know what I’ve done, but geolocation doesn’t work on my laptop’s Firefox. I’ve got so many settings tweaked and privacy guards installed that I can’t even make that little demo above work, I need to look at it in Chrome, where I have no restrictions. Anyway, I’ll experiment more with browser-based geolocation.
Firefox overtook Emacs
Back in September 2012, when Firefox was at version 15 and Emacs at version 24.2, I asked When will Firefox overtake Emacs?
I used R (all the code is included in the post) to generate this chart:
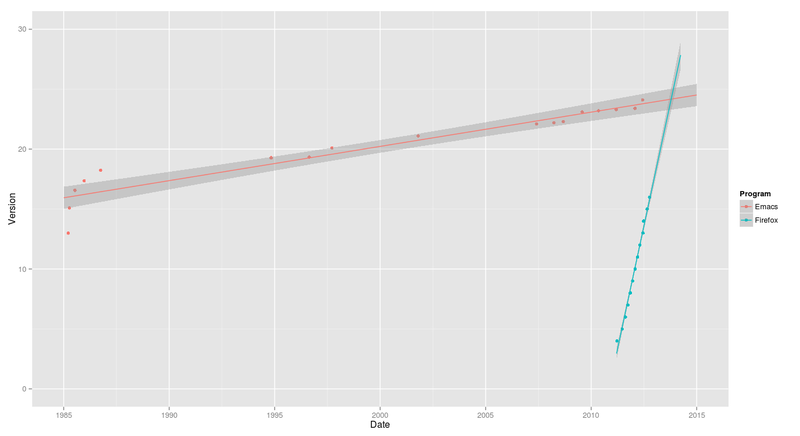
I said, “I don’t know how to extract the range where the lines collide, but it looks like in late 2013 Firefox will overtake Emacs with a version number at or under 25.”
Let’s see how it turned out by looking at current data. Firefox is at 26 now, and Emacs at 24.3.
> library(ggplot2)
> programs <- read.csv("http://www.miskatonic.org/files/se-program-versions-2.csv")
> programs$Date <- as.Date(programs$Date, format="%B %d, %Y")
> head(programs)
Program Version Date
1 Emacs 24.3 2013-03-10
2 Emacs 24.2 2012-08-27
3 Emacs 24.1 2012-06-10
4 Emacs 23.4 2012-01-29
5 Emacs 23.3 2011-03-10
6 Emacs 23.2 2010-05-08
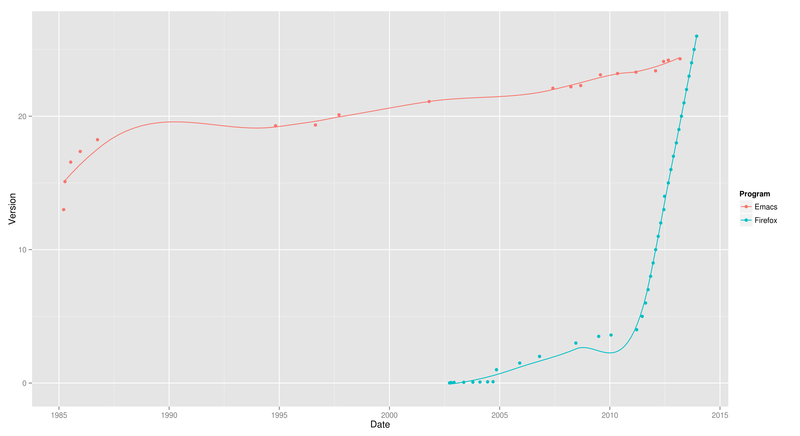
> ggplot(programs, aes(y = Version, x = Date, colour = Program)) + geom_point() + geom_smooth(span = 0.5, fill = NA)Here we see Firefox higher on the y-axis, because of its higher version number:
Now we add regression predicting the future of Emacs:
> ggplot(programs, aes(y = Version, x = Date, colour = Program)) + geom_point() + geom_smooth(span = 0.5, fill = NA)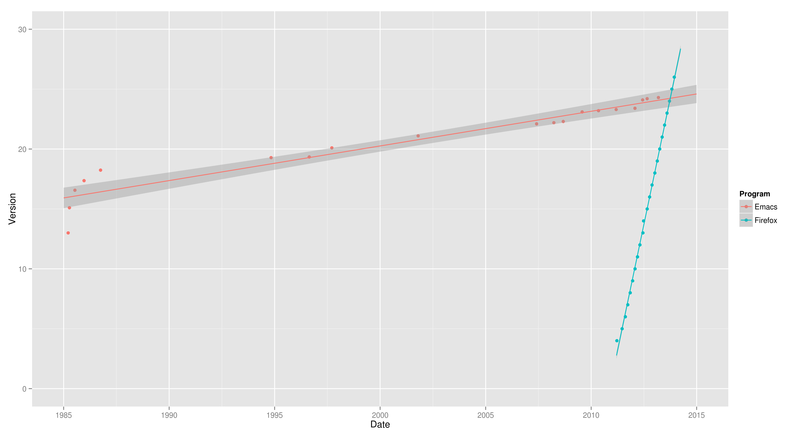
Firefox’s straight line on the right really shows its steady schedule of a new release every six weeks.
Let’s close in on just 2013:
> ggplot(subset(programs, !(Program == "Firefox" & Version < 4)), aes(y = Version, x = Date, colour = Program)) + geom_point() + ylim(0,30) + xlim(as.Date("2013-01-01"), as.Date("2014-01-01")) + stat_smooth(method = lm, fullrange = TRUE)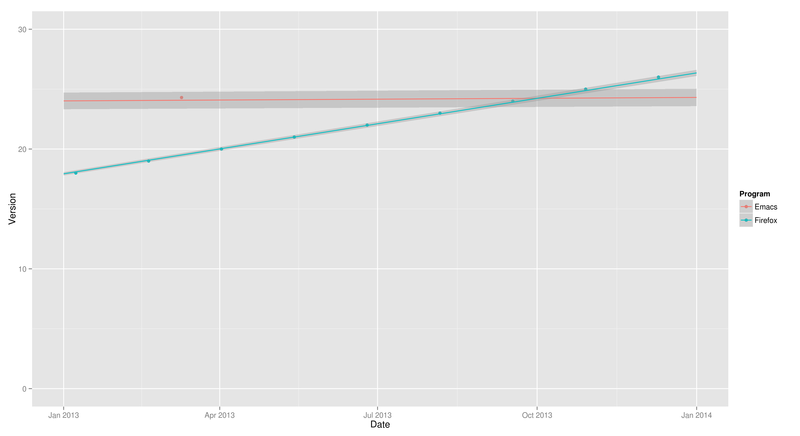
So it did happen in late 2013 (in October), and the version number was just over 24. R’s predictions were correct on both counts!
I still don’t know how to solve the system of the two equations to find where they cross, but hey, I’m enjoying Jekyll so much I couldn’t wait to post.
Jekyll 2
I’ve tweaked a few more things with Jekyll, so, as every Jekyll user seems to do, probably because of the excitement and joy of working with a nice clean new system, I’ll note them down.
SmartyPants
I updated the configuration options to turn on SmartyPants in the RedCarpet Markdown converter:
markdown: redcarpet
redcarpet:
  extensions: ['smart'] # Turns --- into an em dash, poshes up quotes, etc.
Now it turns
'foo' "bar" yes---no 1914--1918
into
‘foo’ “bar” yes—no 1914–1918
The dashes are handled the same as in LaTeX and Org, which is how I like it.
Dates
You can set a variable date in the front matter of any page or post. In a page, it becomes the last-modified date of the page, which I show at the bottom of each page (for example on /about/). In a post, it overrides the date set by the filename of the post. If you have a post in a file named 2014-01-13-foo.md and set the date variable in the post to 2014-01-10 01:00:00 -0500 then Jekyll will date the file to 10 January 2014, not 13 January.
Because of that, I don’t want timestamps automatically updating on posts. It is possible to have Emacs update time stamps automatically, and I could customize it so it knew that the date line is where I want the timestamp, and I could even customize it with per-directory local variables so it did not do this in _posts but only acted on pages.
I decided that’s too much bother for now. Sometimes I don’t want to show that a page has been updated. So I made a little function (taken from EmacsWiki) I can run when needed:
(defun jekyll-timestamp ()
  "Insert a time stamp suitable for use in a Jekyll page or post.  Replaces current text selection."
  (interactive)
  (when (region-active-p) (delete-region (region-beginning) (region-end) ) )
  (insert (format-time-string "%Y-%m-%d %H:%M:%S %z")))
I haven’t bound this to a keystroke, because I don’t think I’ll run it much, and M-x jekTAB is easy to do. The function is defined in setup-jekyll.el in my .emacs.d.
Notify
I got this idea from Brett Terpstra, who’s doing much more complicated things. I just added one line to my Makefile for when I publish the site by using rsync to push it all up to my server:
notify-send "Web site is now live"
notify-send makes a notification pop up on my desktop. Now I can run
make publish
then go into another window and do something, and when the site’s been refreshed I’ll see the alert.
I’ve seen alerts pop up, of course, but I didn’t know about this command. Seems like it could be very useful for small hacks.
Markdown for pages
I had some pages written in HTML that were processed by Jekyll and had the templated applied. I wanted to move them to Markdown but the Markdown versions weren’t showing up on my site. It was because I had foo.md and foo.html both in my souce directory. The foo.html must have ended up overwriting the HTML file generated from foo.md. Deleting foo.html fixed it up, and then I had a happy time updating a bunch of pages and converting them to pure Markdown, for example Twists, Slugs and Roscoes: A Glossary of Hardboiled Slang, which I haven’t updated in about a decade.
Jekyll
This web site is now generated with Jekyll.
Almost five years ago I moved to Drupal from Template Toolkit. Template Toolkit (written in Perl) is just what it says on the tin: a set of tools for using template files to generate web pages and sites.
Back then I wanted a better way of managing my web site: I was editing and generating the RSS feed by hand, if I remember right, which was tedious. I wanted to be able to write more, blog more, and to experiment with CMSes as platforms for programming on the web. Drupal seemed like the best choice. At the time, WordPress seemed to be just for blogs, and I wanted more, so I ignored it. Looking back, I should have gone with WordPress. If I had, I probably wouldn’t be making the change I’m making now.
WordPress is very, very easy to upgrade and it’s possible to keep the system pretty simple. Drupal, on the other hand, is far beyond what I needed for my simple site. I can understand that Drupal can be the right platform for many sites (in the GLAM world, for example, it combines with Fedora to make Islandora) but for me it was too big, too complicated and too scary to upgrade. I used Drush for updates, and it’s a great tool, but still, every time I poked at Drupal I got nervous. Moving from version 6 to 7 or 8 didn’t look pleasant. For all those reasons, I began to think about moving away from Drupal.
But to what? WordPress? I was surprised to find there’s no simple way to migrate from Drupal to WordPress. I guess I could have hacked something together, but I couldn’t really be bothered.
Besides, one thing that bothered me about Drupal would also bother me about WordPress: it’s not text! I like editing in Emacs and I like dealing with plain text. I don’t want to use a GUI editor in a web page. I have It’s All Text installed in Firefox, which helps, and I know there’s some XML-RPC way of talking to Drupal or WordPress that I could configure to work with Emacs, except I tried with Drupal and couldn’t get it to work. In any case, there’s still all the overhead of the CMS.
So I decided to move to Jekyll: “a simple, blog-aware, static site generator. It takes a template directory containing raw text files in various formats, runs it through [some] converters, and spits out a complete, ready-to-publish static website suitable for serving with your favorite web server.” Jekyll’s written in Ruby, now my preferred language, so it’s easy for me to hack on. When I want to move to something else, it won’t be too hard.
Here are some notes on the migration.
Getting my posts out of Drupal
The Drupal 6 migration script didn’t work out of the box, so I had to fiddle a bit, I think because of something to do with tags. This is what I ended up with. It grabs all the blog posts and dumps them out way Jekyll wants them.
#!/usr/bin/env ruby

require 'rubygems'
require 'sequel'
require 'fileutils'
require 'safe_yaml'

host = 'db.example.com'
user = 'username'
pass = 'password'
dbname = 'databasename'
prefix = ''

QUERY = "SELECT n.nid, \
                n.title, \
                nr.body, \
                n.created, \
                n.status,
                u.dst \
           FROM node_revisions AS nr, node AS n, url_alias as u \
          WHERE (n.type = 'blog' OR n.type = 'story') \
            AND n.vid = nr.vid \
            AND u.src = CONCAT('node/', n.nid)
       GROUP BY n.nid"

db = Sequel.mysql(dbname, :user => user, :password => pass, :host => host, :encoding => 'utf8')

if prefix != ''
  QUERY[" node "] = " " + prefix + "node "
  QUERY[" node_revisions "] = " " + prefix + "node_revisions "
end

FileUtils.mkdir_p "_posts"
FileUtils.mkdir_p "_drafts"

results =  db[QUERY]

STDERR.puts "Posts found: #{results.count}"

results.each do |post|
  # Get required fields and construct Jekyll compatible name
  node_id = post[:nid]
  title = post[:title]
  content = post[:body].gsub(/\r/, '')
  created = post[:created]
  time = Time.at(created)
  is_published = post[:status] == 1
  STDERR.puts "#{time}: #{title}"
  dir = is_published ? "_posts" : "_drafts"
  slug = title.strip.downcase.gsub(/(&|&)/, ' and ').gsub(/[\s\.\/\\]/, '-').gsub(/[^\w-]/, '').gsub(/[-_]{2,}/, '-').gsub(/^[-_]/, '').gsub(/[-_]$/, '')
  slug = slug[0..110] # Ran into errors about overly long filenames with truncating like this
  name = time.strftime("%Y-%m-%d-") + slug + '.md'
  permalink = post[:dst]

  # Get the relevant fields as a hash, delete empty fields and convert
  # to YAML for the header
  data = {
    'layout' => 'post',
    'title' => title.to_s,
    'created' => created,
    'permalink' => permalink
  }.delete_if { |k,v| v.nil? || v == ''}.each_pair {
    |k,v| ((v.is_a? String) ? v.force_encoding("UTF-8") : v)
  }.to_yaml

  # Write out the data and content to file
  File.open("#{dir}/#{name}", "w") do |f|
    f.puts data
    f.puts "---"
    f.puts content
  end

end#!/usr/bin/env ruby
require 'rubygems'
require 'sequel'
require 'fileutils'
require 'safe_yaml'
host = 'db.example.com'
user = 'username'
pass = 'password'
dbname = 'databasename'
prefix = ''
QUERY = "SELECT n.nid, \
n.title, \
nr.body, \
n.created, \
n.status,
u.dst \
FROM node_revisions AS nr, node AS n, url_alias as u \
WHERE (n.type = 'page') \
AND n.vid = nr.vid \
AND u.src = CONCAT('node/', n.nid)
GROUP BY n.nid"
db = Sequel.mysql(dbname, :user => user, :password => pass, :host => host, :encoding => 'utf8')
if prefix != ''
QUERY[" node "] = " " + prefix + "node "
QUERY[" node_revisions "] = " " + prefix + "node_revisions "
end
results = db[QUERY]
STDERR.puts "Pages found: #{results.count}"
results.each do |page|
# Get required fields and construct Jekyll compatible name
# node_id = page[:nid]
title = page[:title]
content = page[:body].gsub(/\r/, '')
permalink = page[:dst]
unless permalink.match(/.html$/)
# puts "#{permalink} does not end in html!"
permalink = permalink + "/index.html"
end
created = page[:created]
time = Time.at(created)
# is_published = page[:status] == 1 # Assume everything is published
STDERR.puts "#{time}: #{title} (#{permalink})"
# Get the relevant fields as a hash, delete empty fields and convert
# to YAML for the header
data = {
'layout' => 'miskatonic',
'title' => title.to_s,
'date' => time
}.delete_if { |k,v| v.nil? || v == ''}.each_pair {
|k,v| ((v.is_a? String) ? v.force_encoding("UTF-8") : v)
}.to_yaml
# Write out the data and content to file
dirname = File.dirname(permalink)
unless File.directory?dirname
puts "Creating #{dirname}"
FileUtils.mkdir_p(dirname)
end
File.open(permalink, "w") do |f|
f.puts data
f.puts "---"
f.puts "<h1>#{title.to_s}</h1>\n"
f.puts content
end
end#!/bin/sh
for I in *.md; do
echo $I
maruku -o foo.html $I
donename: Miskatonic University Press
description: William Denton
markdown: redcarpet
pygments: true
permalink: /:year/:month/:day/:title
TZ: America/Toronto
encoding: UTF-8
paginate: 5
paginate_path: posts/page:num
include: ['.htaccess', 'js', 'css']
exclude: []
url: http://www.miskatonic.org
rss_path: /
rss_name: feed
destination: /var/www/miskatonic/local/dynamic/all: build combine
build:
jekyll build
combine:
rsync --archive --verbose /var/www/miskatonic/local/dynamic/ /var/www/miskatonic/production/
rsync --archive --verbose /var/www/miskatonic/local/static/ /var/www/miskatonic/production/
publish:
rsync --archive --compress --itemize-changes /var/www/miskatonic/production/ pair:public_html/miskatonic.org/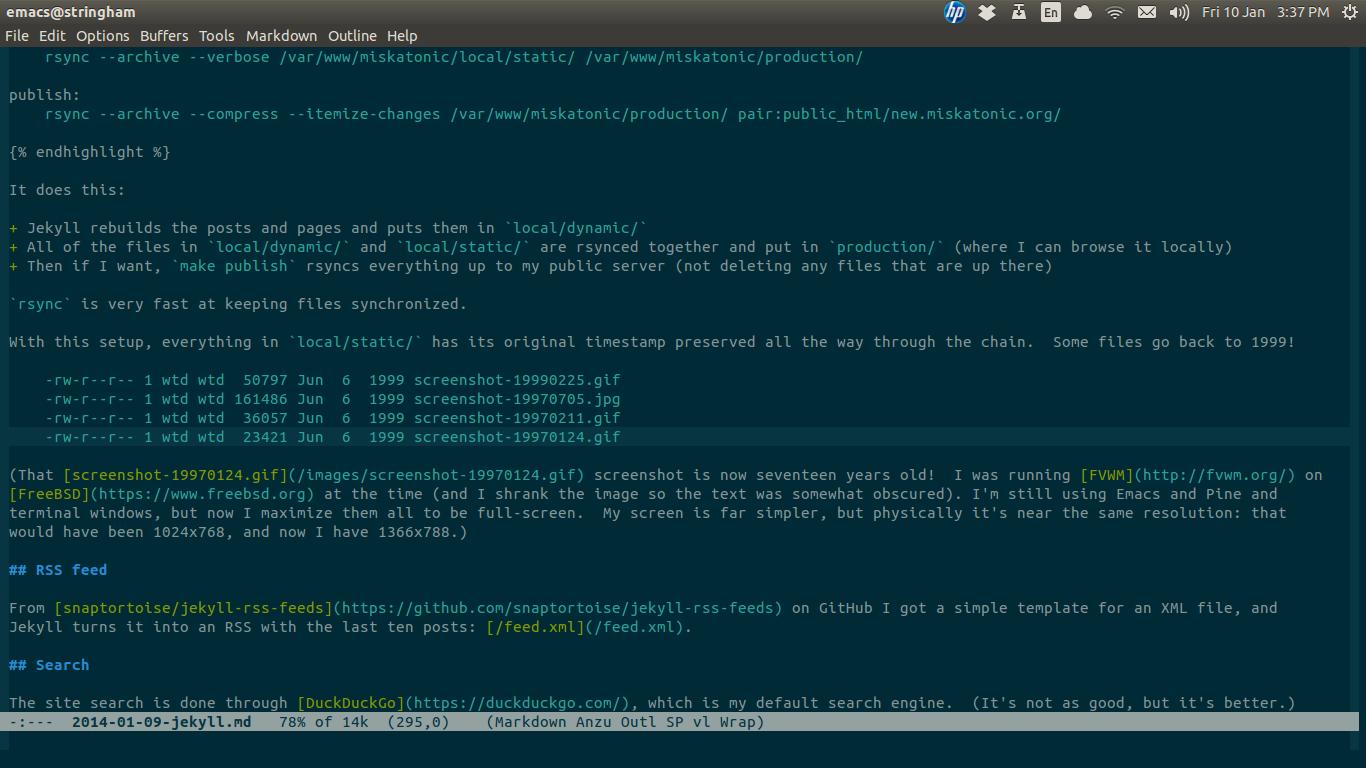
RSS feed
From snaptortoise/jekyll-rss-feeds on GitHub I got a simple template for an XML file, and Jekyll turns it into an RSS with the last ten posts: /feed.xml.
Search
The site search is done through DuckDuckGo, which is my default search engine. (It’s not as good, but it’s better.)
Good and bad about Jekyll
On the good side, I love being able to write in Markdown to a local file and then use the command line to update the site and push it live. I’ll look into how I can integrate it with Org mode, too. The syntax highlighting with Pygments will be nice. And no more worries about upgrading! Anything that happens with Jekyll will be easy to manage, I’m sure, and if something comes up I don’t like, I can just stick with an older version—-there can be no security implications, because it’s just a static site.
One bad thing is that there’s no way to do comments. I could use an external commenting system, but in the five years I was on Drupal, I didn’t get many comments. I appreciated all the ones I did (thanks to everyone who left a comment!) but unless and until I add some way of doing comments here, people will just have to email me or catch me on Twitter (@wdenton).
To do
- Some redirections are in place that I’d rather have as rewrites.
- Add an XML sitemap.
- Get some visitor analysis working, either by analyzing the logs or with Piwik.
- Use Emacs’s time-stamping to my benefit.
Conclusion
I think all of the content is moved over and everything is working. If not, let me know.
Org and poems
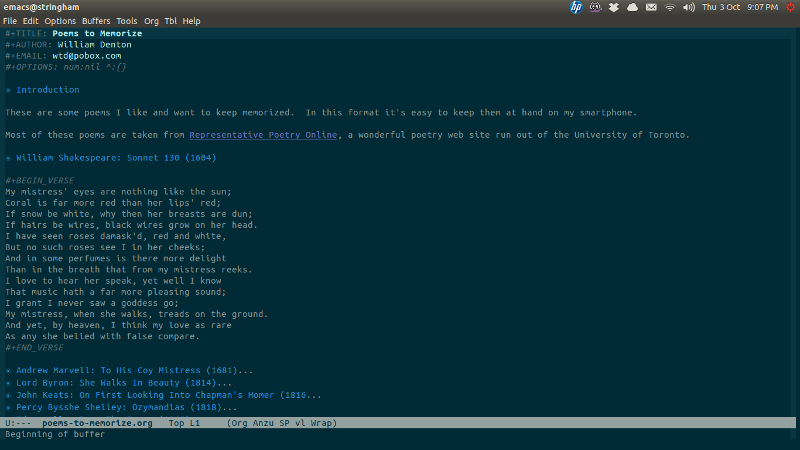
I’ve found a much easier way to manage my Poems to Memorize EPUB book, which is a pretty simple ebook listing a bunch of poems that I like to have at hand because I want to keep them memorized and sometimes I need to check on a line or stanza. (I explain more in this posting from January 2011.)
I used to generate it by hand, which of course is madness. Over the last few months I’ve become a big fan and daily user of Org mode, an Emacs extension that elevates even such an Olympian tool to heights hardly dreamt of by Athena herself.
Any road up, here’s what it looks like:
Exporting to LaTeX is easy: I hit the cryptic keystrokes C-c C-e l l (where C-c is “Control-c”):
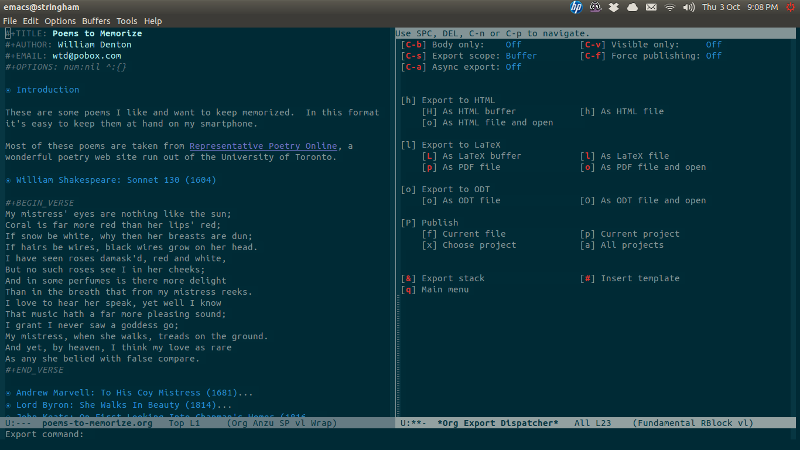
Now that I have a LaTeX file, it’s one step to use Pandoc to convert it to EPUB. (I can’t export directly from Org right now, but perhaps that will be possible some day. In the meantime, crosswalking it through LaTeX isn’t bad.)
$ cd ~/epub/poems/
$ ll
total 76
-rw-rw-r-- 1 wtd wtd 25397 Oct  3 20:52 poems-to-memorize.org
-rw-rw-r-- 1 wtd wtd 29145 Oct  3 21:09 poems-to-memorize.tex
$ pandoc -o poems-to-memorize.epub poems-to-memorize.tex
$ ll
total 112
-rw-r--r-- 1 wtd wtd 25727 Oct  3 21:26 poems-to-memorize.epub
-rw-rw-r-- 1 wtd wtd 25397 Oct  3 20:52 poems-to-memorize.org
-rw-rw-r-- 1 wtd wtd 29145 Oct  3 21:09 poems-to-memorize.tex
$ file poems-to-memorize.epub
poems-to-memorize.epub: EPUB ebook data
No pictures in it yet, but maybe I’ll add some now that it’s so easy to manage.
M-x all-praise-emacs M-x all-praise-org-mode
Avoirdupois 1.0
If you use the augmented reality application Layar then you may be interested in Avoirdupois, a point of interest (POI) provider I’ve made. Avoirdupois provides the fairly simple web service that Layar needs so that it can show users POIs near where they are. It’s written in Ruby and uses the Sinatra web application framework. If you have a set of geolocated points and want to present them in an augmented reality app, this will do it.
The README has all the instructions you need to download it and try it out, assuming you’re OK at the command line and have some basic Git and Ruby skills. You should be able to copy and paste the commands in the README and make everything on your local machine. Deploying it in production is more advanced but not that much more. If I can do it, so can you.
I’m running two layers with it right now, and I have at least one more to add soon:
- York University, Toronto (AR-enhanced view of York’s two campuses)
- YU Alternative Campus Tour (which goes with the Alternative Campus Tour of York University in Toronto; not much content)
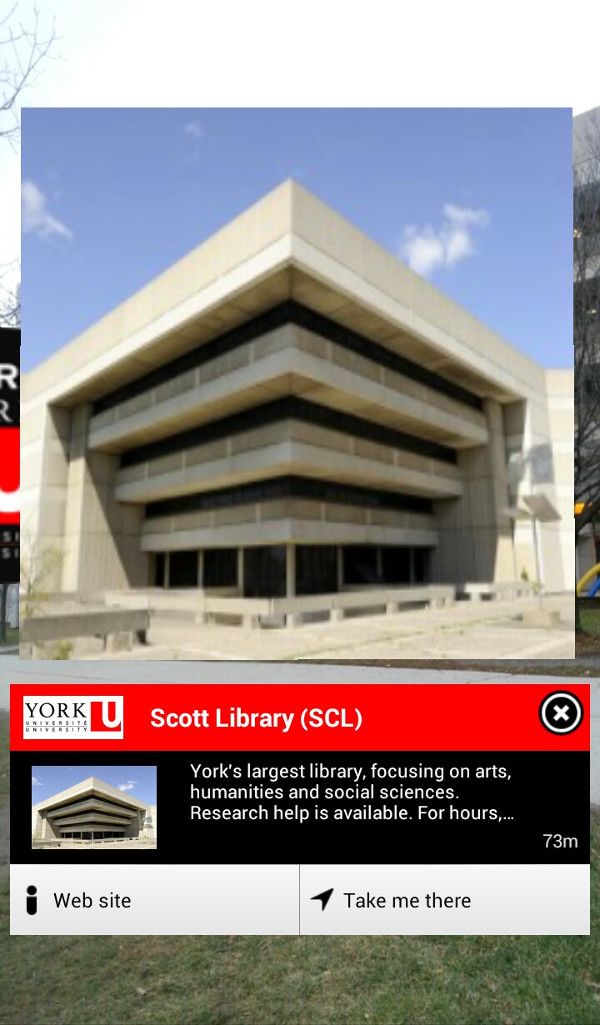
Below is what the York layer looks like (in a slightly older version of Layar). I grabbed this screenshot on the York campus while pointing my phone towards the Scott Library, a big Brutalist thing like so many other 1960s libraries. Layar is floating an image of Scott in midair, overtop of the real library in the camera view (notice the tree and sky in the background), and at the bottom is some information about the building.
If you’re curious about what Avoirdupois actually does, here’s an example of the JSON it gives out if you ask it for points of interest in this layer, as required by Layar’s GetPOIs Response documentation:
{
  "layer": "yorkuniversitytoronto",
  "showMessage": "Filters are available through Layer Actions in settings.",
  "refreshDistance": 100,
  "refreshInterval": 300,
  "hotspots": [
    {
      "id": 113,
      "text": {
        "title": "York – Village West Shuttle",
        "description": "",
        "footnote": ""
      },
      "anchor": {
        "geolocation": {
          "lat": 43.7731,
          "lon": -79.5032
        }
      },
      "imageURL": "http://www.yorku.ca/web/css/yeb11yorklogo.gif",
      "biwStyle": "collapsed",
      "showSmallBiw": true,
      "showBiwOnClick": true,
      "actions": [],
      "icon": {
        "url": "http://avoirdupois.miskatonic.org/icons/yorkuniversitytoronto/york-ciw-110x110.png",
        "type": 0
      }
    },
Layar takes that and turns it into what you saw in the screenshot.
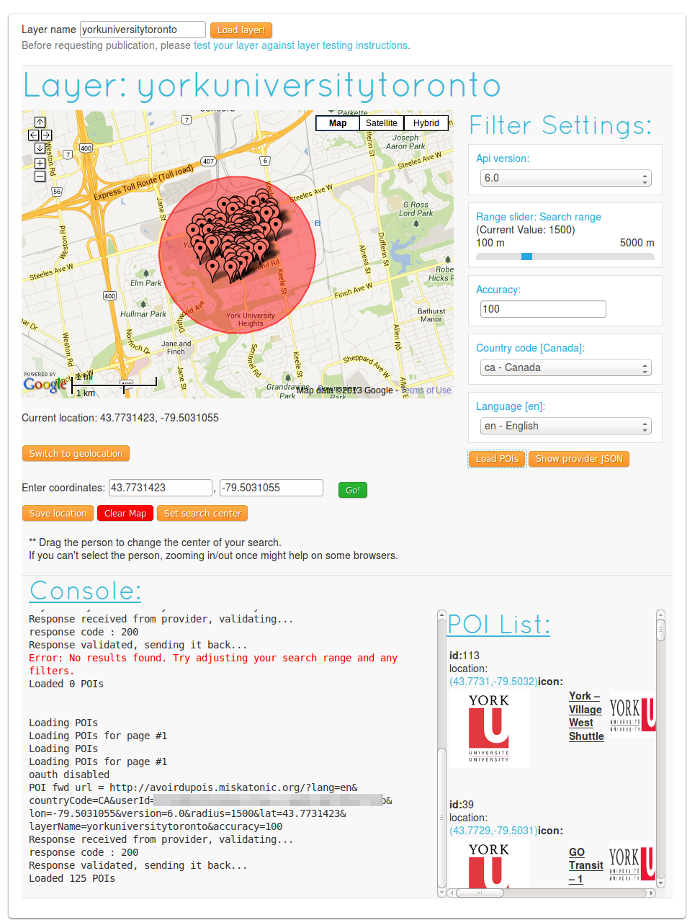
Here’s a screenshot of the Layar test page for this layer, where I’ve picked a point on the York campus and have it query Avoirdupois to make sure everything works properly. If you set up something in Layar you’ll spend a little while, but not too long, on pages like that, tinkering with things to get it working, but it’s not hard.
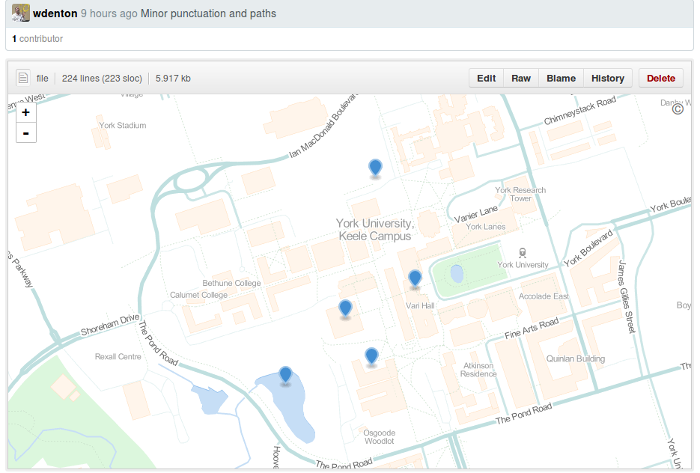
Static sets of points of interest are set up in a GeoJSON file. That’s not hard to do, and an advantage of using GitHub is that you can view the information as a map, and edit it, right in your browser:
You run a Ruby script to load the GeoJSON config file into the Avoirdupois database and then everything should just work.
There are many things to be done with Avoirdupois that would make it better right away (such as tests—there are no tests!). This is not beautiful code, but it works, and it might be useful. If you want to contribute you’d be welcome. One of my plans is to look at extending it so it can drive geolocated channels in Wikitude and Junaio, which would mean you could serve up the same data in all three apps without doing any special work.
Or serve it up in other apps. I used GeoJSON for the POI configurations because it’s easy to manage and easy to reuse. I want to present useful information in an augmented reality view through Layar and other apps … but a fundamental point in all of this is that the data should be usable for other purposes and presentable in other ways.
The code isn’t complicated, and you’re welcome to rip out bits of it for your own purposes if it’s at all useful. When I had the Ruby in place to generate the right JSON I reused it for Laertes, which gathers together geolocated tweets using a defined hash tag with points of interest from Google Maps to give an AR view of goings on and happenings for everyone at an event or conference. (I posted about Laertes here and here.)
The Feynman Lectures
I was delighted to see that The Feynman Lectures on Physics (volume one only right now) are online and freely available. These lectures are masterpieces.
Everyone should read the first, Atoms in Motion. Better yet, if you can, find the audio recording—all of these lectures were recorded when Feynman gave them—because nothing in print can capture the excitement and joy that comes across in Feynman’s voice when he’s talking about science. The first time I listened, I was grabbed from the first sentences:
This two-year course in physics is presented from the point of view that you, the reader, are going to be a physicist. This is not necessarily the case of course, but that is what every professor in every subject assumes! If you are going to be a physicist, you will have a lot to study: two hundred years of the most rapidly developing field of knowledge that there is. So much knowledge, in fact, that you might think that you cannot learn all of it in four years, and truly you cannot; you will have to go to graduate school too!
“I’m going to teach you this from the point of view that you’re going to do this for a living” is a good way to approach any kind of teaching (or, as we sometimes call it in the library world, “instruction”).
The Relation of Physics to Other Sciences, the third lecture, is equally readable by anyone, regardless of scientific background. Here’s the introduction:
Physics is the most fundamental and all-inclusive of the sciences, and has had a profound effect on all scientific development. In fact, physics is the present-day equivalent of what used to be called natural philosophy, from which most of our modern sciences arose. Students of many fields find themselves studying physics because of the basic role it plays in all phenomena. In this chapter we shall try to explain what the fundamental problems in the other sciences are, but of course it is impossible in so small a space really to deal with the complex, subtle, beautiful matters in these other fields. Lack of space also prevents our discussing the relation of physics to engineering, industry, society, and war, or even the most remarkable relationship between mathematics and physics. (Mathematics is not a science from our point of view, in the sense that it is not a natural science. The test of its validity is not experiment.) We must, incidentally, make it clear from the beginning that if a thing is not a science, it is not necessarily bad. For example, love is not a science. So, if something is said not to be a science, it does not mean that there is something wrong with it; it just means that it is not a science.
And here’s the final paragraph
A poet once said, “The whole universe is in a glass of wine.” We will probably never know in what sense he meant that, for poets do not write to be understood. But it is true that if we look at a glass of wine closely enough we see the entire universe. There are the things of physics: the twisting liquid which evaporates depending on the wind and weather, the reflections in the glass, and our imagination adds the atoms. The glass is a distillation of the earth’s rocks, and in its composition we see the secrets of the universe’s age, and the evolution of stars. What strange array of chemicals are in the wine? How did they come to be? There are the ferments, the enzymes, the substrates, and the products. There in wine is found the great generalization: all life is fermentation. Nobody can discover the chemistry of wine without discovering, as did Louis Pasteur, the cause of much disease. How vivid is the claret, pressing its existence into the consciousness that watches it! If our small minds, for some convenience, divide this glass of wine, this universe, into parts—physics, biology, geology, astronomy, psychology, and so on—remember that nature does not know it! So let us put it all back together, not forgetting ultimately what it is for. Let it give us one more final pleasure: drink it and forget it all!
But as I said, if you can listen to the lectures, do it. Hearing Feynman himself is unforgettable.
Greenhouse Glasses
Meta is having a Killer App Ideas contest to get people thinking about and then working on applications for their augmented reality glasses, which look to be for sale next April to regular folks. If you like this idea then please vote for it.
I propose Greenhouse Glasses. Augmented reality to help us understand and prevent climate change: by seeing power use, greenhouse gas (GHG) emissions, carbon footprints and climate data around us; by mediating our view of reality to show how the region we’re in will be affected by climate change in 2100; and by overlaying objects with factual or artistic climate-related information and interventions.
Greenhouse Glasses are a tool to help prevent catastrophic climate change.
Here are some of the things the app would do. There are more possibilities, and better ones, but these are a start. Some of this is very possible right now, but some of it will take a fair bit of work, if not in the programming of the AR then in getting the data.
Shopping
When out shopping, the app will identify products and show their carbon footprints. I don’t mean hold up a smartphone and scan the bar code and see a number. I mean look at a product and see the number added to the package, right there on the tin of peas or pint of milk: augment reality with the information the producer didn’t put on. Do it by recognizing the packaging, if possible, but use the bar code if necessary. (This along the lines of the Buycott app.)
Travelling
When you’re in a car, bus, subway, plane, or whatever, or you’re out walking or riding a bicycle, show how much fuel is being used or saved. Show the bad and the good. Have an indicator rising when you’re driving your car alone—show the cumulative greenhouse gas output so far this month—and then going down when you’re on the subway.
It must be easy for devices to figure out when you’re travelling: if you’re moving faster than n km/hr on land then you’re in some kind of vehicle; mapping and GPS would show if you’re on a road; if you disappear at a subway entrance and reappear twenty minutes later at another one then the trip can be inferred; same if you go to an airport and two hours later you’re in another city. Google Now can know a lot about your travel plans too. If it can, this app can.
Some configuration will be necessary for Greenhouse Glasses. You’ll need to tell it what kind of car you own, for example. Perhaps you’ll need to specify which bus you take in a commute. Other times it will ask you for a detail or to confirm something (“Did you just take the subway from St. George to Downsview?”) and then it can remember that adapt to your patterns.
At home
Recognize devices like microwaves, refrigerators, televisions, furnaces and air conditioners and show how much power they use. This would require configuration, but once you’ve told it what model your fridge is it will know how much power it draws, then it can show that and the carbon footprint on the door. Of course, when you open up the fridge and look inside, you’ll see the footprints on everything inside too.
If you’ve got something like The Energy Detective then you can see how much power your home is using. Power requirements for most devices are known or can be measured with a device like a Kill-a-Watt. (I had one and measured a bunch of my stuff, then donated it to the York library, where it is now an item on 3-day reserve.)
Walk around your house and see power use and carbon footprint information on all of your electrical devices. Turn them off and see how much standby power they draw.
Monitor room temperature in summer or winter to show how changing the thermostat by a degree or two could affect power use. Maybe the glasses could suggest changing the temperature by a degree, and if you wave yes it talks to your thermostat and makes the change.
Change the colour of something to indicate power use. Make a carpet go red as your home uses more power.
A note about carbon footprints
There seem to be two problems with getting carbon footprint information on products: it’s hard to calculate and the data isn’t freely available. In the UK Tesco was putting carbon footprint labels on products a few years ago, but it fizzled out. Here’s a bit of what I’ve found out.
The Carbon Trust in the UK has done a lot of work on this, and they have “27,000 certifiable product carbon footprints” as determined with a program called Footprint Expert. Maybe it’s possible to use that data?
Also, researchers at the Lenfest Center for Sustainable Energy at Columbia University have done a lot of work on this problem. They did a Life Cycle Assessment project: “In 2009 and in partnership with the Carbon Trust, we assisted PepsiCo in determining and publishing the first ever certified product level carbon footprint in North America, of Tropicana brand orange juice in a 64 oz carton.” How Green Is My Orange? (NYT, 21 January 2009) reported:
PepsiCo hired experts to do the math, measuring the emissions from such energy-intensive tasks as running a factory and transporting heavy juice cartons. But it turned out that the biggest single source of emissions was simply growing oranges. Citrus groves use a lot of nitrogen fertilizer, which requires natural gas to make and can turn into a potent greenhouse gas when it is spread on fields.
PepsiCo finally came up with a number: the equivalent of 3.75 pounds of carbon dioxide are emitted to the atmosphere for each half-gallon carton of orange juice. But the company is still debating how to use that information. Should it cite the number in its marketing, and would consumers have a clue what to make of it?
That number (3.75 lb, or 1.7 kg) may be different now—perhaps they’ve been able to reduce the footprint. (As to how to use that information, Tropicana’s environmental information says that they manage their carbon footprint, and it links to the NYT article, but it doesn’t actually give the number there.)
The researchers continued on with more work and published Fast Carbon Footprinting for Large Product Portfolios in the Journal of Industrial Ecology 16:5 (October 2012). That’s behind a paywall, but here’s the abstract:

Publicly Available Specification 2050-2011 (PAS 2050), the Green House Gas Product Protocol (GHGPP) standard and forthcoming guideline 14067 from the International Organization for Standardization (ISO) have helped to propel carbon footprinting from a subdiscipline of life cycle assessment (LCA) to the mainstream. However, application of carbon footprinting to large portfolios of many distinct products and services is immensely resource intensive. Even if achieved, it often fails to inform company-wide carbon reduction strategies because footprint data are disjointed or don’t cover the whole portfolio. We introduce a novel approach to generate standard-compliant product carbon footprints (CFs) for companies with large portfolios at a fraction of previously required time and expertise. The approach was developed and validated on an LCA dataset covering 1,137 individual products from a global packaged consumer goods company. Three novel techniques work in concert in a single approach that enables practitioners to calculate thousands of footprints virtually simultaneously: (i) a uniform data structure enables footprinting all products and services by looping the same algorithm; (ii) concurrent uncertainty analysis guides practitioners to gradually improve the accuracy of only those data that materially impact the results; and (iii) a predictive model generates estimated emission factors (EFs) for materials, thereby eliminating the manual mapping of a product or service’s inventory to EF databases. These autogenerated EFs enable non-LCA experts to calculate approximate CFs and alleviate resource constraints for companies embarking on large-scale product carbon footprinting. We discuss implementation roadmaps for companies, including further road-testing required to evaluate the effectiveness of the approach for other product portfolios, limitations, and future improvements of the fast footprinting methodology.
More carbon footprint information:
- What’s the carbon footprint of …? at the Guardian, drawing on Mike Berners-Lee’s book How Bad Are Bananas? The Carbon Footprint of Everything.
- US EPA’s Household Carbon Footprint Calculator
- HP carbon footprint calculator for printing (you can compare HP printers to ones made by other companies)
- CO2 released when making and using products
Back to Greenhouse Glasses.
Outside: energy use around you
When you’re outside, show current temperature and pollution data. That’s not climate, but it’s useful and it’s related, and anyone wearing this app will be smart enough to know the difference and won’t say “Haw haw, where’s your global warming now?” if there’s a snowstorm in January or a cool breeze chills the evening air in July.
Show a building’s energy use and greenhouse gas emissions right on the building.
Where to get this data? For many buildings we’d need to estimate it but in some places there are online energy dashboards with publicly available data. For example, the UC San Diego Energy Dashboard has charts covering power usage of “sixty of the largest buildings” of the 450 on campus (they’re adding more), down to sub-meters inside some buildings. Here’s the last week of total power consumption of the Geisel Library (which readers of Rainbows End will remember):
As I write it’s averaging 520 kW of electricity use. (I don’t see a link to get a feed of the data, but the UCSD people will have one, and it could be made public.) The Geisel’s a crazy building and I’m bad with graphics, so I can’t paste a nice 520 right on the building like I could with a boring glass office building, but I can make the number float beside it:
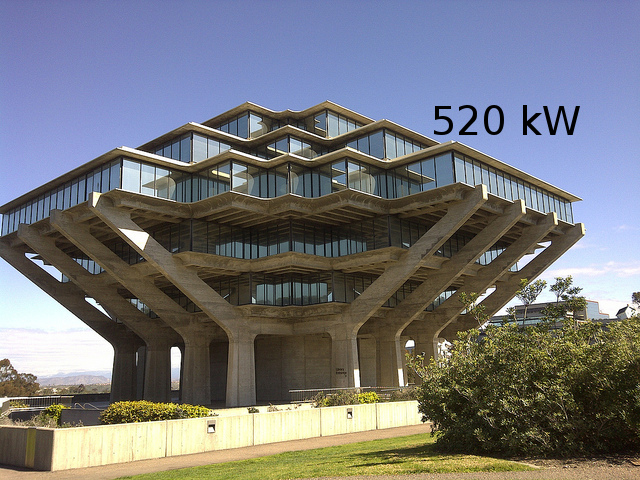
(Photo of the Geisel Library courtesy Flickr user rowdydogs; it’s CC BY-NC-SA.)
If I was walking around UCSD I’d love to see data like this overlaid on the buildings there. Even more, I’d like to see it at York University, where I work! We use PowerLogic’s ION Enterprise Energy Management system. It measures power usage by building and sometimes by units within buildings. It’s possible to get data feeds from an API, but we’re not running it yet.
Some other dashboards:
- City of Bloomington, Indiana (shows power use in city hall and a recreation centre)
- Simon Fraser University, such as a power usage chart for TASC 1, home to comp sci and environmental and earth sciences
- Carbon Culture shows power usage for some public buildings in the UK, such as 10 Downing Street and the Tate Modern (in mid-July it was averaging 815 kg/hour of CO2e)
Outside: power demand and production
Show how much power is being used in your province, state or region. In Ontario, the Independent Electricity System Operator shows today’s electricity market numbers. Assuming all major power sources (power plants, dams, solar panel installations) have data feeds or known numbers for how much power they generate, show that when you’re near one. (The IESO has data feeds for that, which I’ll write up separately.)
Float numbers and data visualizations all around you showing where power is coming and going.
Outside: greenhouse gas production and sequestration
In Canada any source emitting over 50,000 metric tonnes of greenhouse gases must report to the government. The data is available on the government’s web site, but it was awkward to deal with, so I munged some of it a bit and put the results on GitHub so I could take advantage of how it maps GeoJSON.
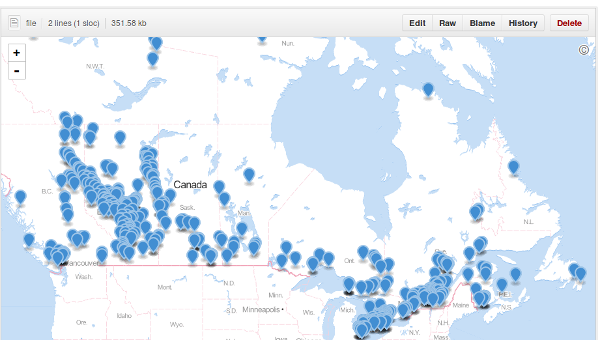
Hello Alberta! (And well-populated areas along the Saint Lawrence Seaway.)
The Greenhouse Gas Emissions Reporting Program has more granular and historical data. (I may munge that too.) Here’s York University’s main campus:
| Measurement | 2010 | 2011 |
|---|---|---|
| Carbon dioxide (CO2) from non-biomass in CO2e (t) | 50,514 | 55383 |
| Carbon dioxide (CO2) from biomass in CO2e (t) | 0 | 0 |
| Methane (CH4) in CO2e (t) | 206 | 229.74 |
| Nitrous oxide (N2O) in CO2e (t) | 369 | 427.8 |
| Sulphur hexafluoride (SF6) in CO2e (t) | 0 | 0 |
| Hydrofluorocarbons (HFCs) in CO2e (t) | 650 | 0 |
| Perfluorocarbons (PFCs) vin CO2e (t) | 0 | 0 |
| Total CO2e from all sources in CO2e (t) | 51,379 | 56,041 |
Equivalent American data is available at data.gov, such as Complete 2010 Greenhouse Gas Data. Here’s a clipping of some XML about emissions from Columbia University in New York City (in the full source the total emissions are broken down by type), showing 81,220 metric tonnes of greenhouse gases emitted in 2010:
<FacilitySite>
  <FacilitySiteName>COLUMBIA UNIVERSITY-410 W 118TH ST</FacilitySiteName>
</FacilitySite>
<TotalNonBiogenicCO2eFacilitySubpartsCtoJJ massUOM="Metric Tons">81220.5</TotalNonBiogenicCO2eFacilitySubpartsCtoJJ>
Whenever you’re near a major greenhouse gas emitter, show it. If you can get more information about the source and company and purpose, show it.
And wherever greenhouse gases are being sequestered or captured, show it. (Need to find data sources for that.)
Comparing footprints
This is dodgier, but there must be some helpful way of comparing your carbon footprint to other people, especially to the per capita average in your country or similar countries. CAIT 2.0, the climate data explorer made by the World Resources Institute, is a nice way of seeing and getting this data. It has per-capita total emissions in some selected countries in tCO₂e, such as this:
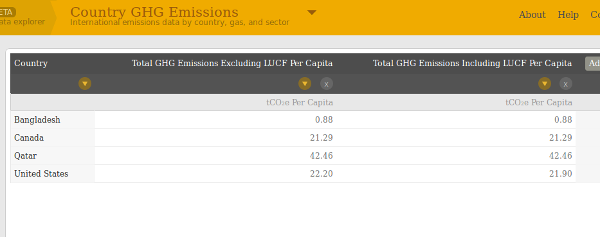
You can export the data in CSV for easy reuse. Great for importing into any application. (LUCF is land-use change and forestry.)
| Country | Total GHG Emissions Excluding LUCF Per Capita | Total GHG Emissions Including LUCF Per Capita |
|---|---|---|
| Bangladesh | 0.88 | 0.88 |
| Canada | 21.29 | 21.29 |
| Qatar | 42.46 | 42.46 |
| United States | 22.20 | 21.90 |
Changing climate
Show how the climate where you are is changing. Even in the face of the Conservative government’s sustained attack on science in Canada Environment Canada is publishing data such as the Climate Trends and Variations Bulletin - Annual 2012.
The national average temperature for the year 2012 was 1.9°C above baseline average (defined as the mean over 1961-1990 reference period), based on preliminary data, which is the 5th warmest observed since nationwide records began in 1948. The warmest year on record was 2010 when the national average temperature was 3.0°C above the baseline average. The coolest year on record was 1972 when the national average temperature was 1.9°C below the baseline average. As the temperature departures map below shows, all of the country had temperatures at or above the baseline average this year, with most of the Northwestern Territories, Nunavut, Ontario, Quebec and Newfoundland experiencing temperatures more than 2°C above the baseline average.

Data on how temperatures have shifted up over the past decades is available for regions all over the world. Show it so you know that this year it’s about two degrees (in my case) hotter than it used to be. What would be the best way to show this kind of information in an AR view?
Show floods and droughts
Climate change is making sea levels rise. Here’s the view of New Orleans at Surging Seas showing which parts would be affected:
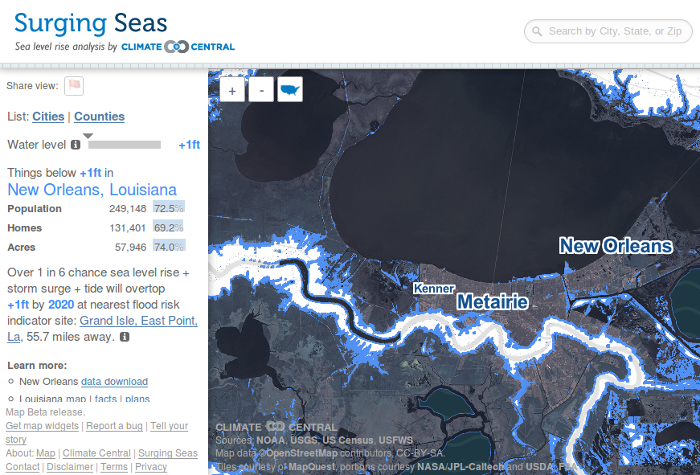
Visualizations have been made like this for coastal areas all over the world. That’s not augmenting reality, though. Greenhouse Glasses will show the water lapping around your ankles wherever sea level rise will be noticeable. Take the low and high ends of the best estimates for sea level rise by 2100 . When you’re near the coast, the app will know, and it will also know your altitude. Subtract the sea level rise. Any height left over, show that amount of water around your feet. Maybe you’ll be walking over just a thin sheen or maybe you’ll be wading through it up to your knees.
Apply the same view inside buildings to see how they’ll be affected. Optional accessory: augmented reality mould on the walls.
(I think I got this idea of AR sea level rise from Mark Skwarek, but I can’t find a source now. Maybe it was someone else in Manifest.AR?)
In areas that will be affected by drought, show it somehow, perhaps by replacing the ground with dead crops or cracked dried mud.
Augmediation to show corporate and political power
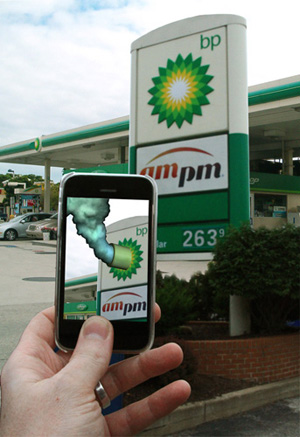
Mark Skwarek made The Leak in Your Home Town. It’s a reaction to the Deepwater Horizon explosion in 2010: “an iPhone app that lets users see the BP Deepwater Horizon oil spill whenever they see a BP logo. A user simply launches the app and aims their iPhone’s camera at the nearest BP logo. What the user sees is one of the broken BP pipes coming out of the BP logo, and out of the pipe comes the oil, pluming upward.”
Greenhouse Glasses would have augmediated interventions like this everywhere. All kinds of company logos are ripe for this treatment. Why see them as they are? Why not replace them with something else, like a data visualization or a picture of a leaking oil pipe? Or a kitten, if you’re having a bad day.
Show information, too. What are the greenhouse gas emissions of the company? How much money have they spent lobbying politicians and fighting climate change regulation? Do they fund climate deniers? (Maybe you’re looking at the logo of a climate-denying organization. It would be nice to pop up a warning.)
Election signs would be very different through Greenhouse Glasses. Find out who’s giving money to candidates (for an American example, see the data on Koch Industries at OpenSecrets) and overlay that on the signs.
Next time you pass by a Whole Foods, see “Climate change is perfectly natural and not necessarily bad” – CEO John Mackey overtop the sign.
Show art. Surprise the user.
Warning: Gamification and solutionism
I’m Canadian, so comparing my country’s per capita emissions to America’s, and me to an average Canadian or American, is reasonable. What does it mean to compare Canada to Bangladesh or Qatar, or me to someone who lives in either? I don’t know. I picked them because I knew the first would have very low emissions and the second high. Considering all the aspects of such a comparison is beyond this post, and me.
What I wouldn’t want in comparing me to other Canadians, or to Americans, or to people I know, or people who sign up for some kind of GHG-measuring service, is to go all-out into gamification (“Exclusive Gamification Sponsor: BadgeVille”). I get a little badge if I lower my emissions by 10%, or I get a Public Transit badge for taking the subway to work, or a Bird-Friendly badge for buying (or not) some certain kind of coffee. I get some badges, you get some badges, we all get some badges and we post them on Facebook and Twitter. Gamification doesn’t do anything for me. But if it works for this and supports the larger goal of preventing catastrophic climate change, fair enough. Climate change isn’t a game, though. It’s droughts and floods and heat waves and worse.
Greenhouse Glasses also aren’t meant to be a personal measuring tool or quantified self app. They will measure and display, but the point is not just to keep track of your carbon footprint but to understand what is going on in the world around you scientifically, socially and politically.
If you’ve read Evgeny Morozov’s excellent book To Save Everything, Click Here then you’ll recognize these lines of thought.
Problem: Privacy
What I’m describing involves a lot of data, a lot of measurement, a lot of personal information (it’s your own business what products you look at in a store), all of which means a lot of privacy problems. Especially when we know that the NSA and related spy agencies can get at anything they want.
It’s worth reading Tim Maly’s On the Leakiness of Surveillance Culture, the Corporate Gaze, and What That Has To Do With the New Aesthetic. A quote:
Surveillance culture is leaky. Primary measurements beget chains of reasoning and implication. Second and third order conclusions can be drawn by clever observers and unintended consequences are the order of the day. That’s how we end up with stories of Target outing pregnant teens to their parents through the ultra-empathetic medium of coupons.
…
The same forces that make copyright untenable make surveillance inevitable. Computers are copying machines. They make copies of everything, including every action that you take within their field of sensation.
Historically, that’s meant the things that happen online, with the main avenue of input being keystrokes. But as we wire up the rest of the planet with cameras, accelerometers, potentiometers, microphones, thermal sensors, pressure plates, and switches, that means the computer and corporate gaze will reach everything, everywhere, always.
I don’t have an answer for this problem.
Conclusion
Greenhouse Glasses show how climate has already changed, how it will change more, what the future will look like, what role you play, how you can might change your behaviour, and how the situation is being manipulated socially and politically. They inform, enlighten and surprise. They are science and they are art. They make you more aware of and more connected with the world around you, and give you a better understanding of how everything is working, from power plants to political lobbying.
Greenhouse Glasses are a tool to help prevent catastrophic climate change.